Aquatics FAQs
Recommendations for Fully Vaccinated People
COVID-19 Homepage
Early Detection

Interpretive Summary for February 3, 2022
Early Detection
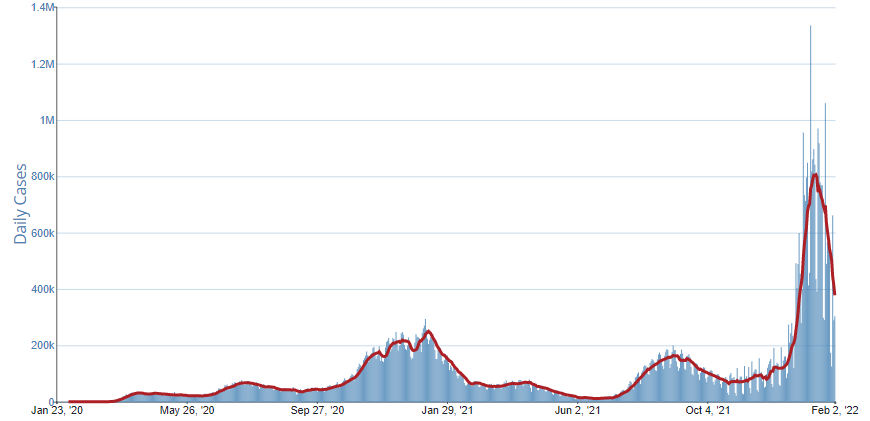
COVID-19 cases and hospitalizations are continuing to decline across the United States. As of February 2, 2022, cases are down 53.1% from their peak on January 15. However, community transmission is still high nationwide. According to CDC’s Nowcast projections for the week ending January 29, 2022, the proportion of the Omicron variant circulating in the United States is predicted to be greater than 99%.
Omicron is extremely contagious. The COVID-19 vaccines available in the United States are effective at protecting people from getting seriously ill, getting hospitalized, and even dying. Everyone in the United States ages 5 years and older is eligible to receive a COVID-19 vaccine. Everyone ages 12 years and older is eligible to receive a COVID-19 booster dose if enough time has passed since completion of their primary series. To find a vaccine provider near you, visit vaccines.gov.
Wastewater (sewage) surveillance is a promising tool for tracking the spread of SARS-CoV-2, the virus that causes COVID-19. Many people with COVID-19 shed the virus in their feces, so testing wastewater can help us find COVID-19 in communities. Wastewater testing has been successfully used as a method for detection of other diseases, such as polio. Wastewater surveillance results can provide an early warning of increasing COVID-19 cases and help communities prepare.
On February 3, 2022, COVID Data Tracker released a Wastewater Surveillance tab, which tracks SARS-CoV-2 levels in sewage at more than 400 testing sites across the country. This marks the first time CDC’s wastewater surveillance data is available for download. See “A Closer Look” below for more information about this method of data collection.
- COVID Data Tracker released a new COVID-19 Wastewater Surveillance tab that displays data on SARS-CoV-2 RNA levels by county and across the United States.
- COVID Data Tracker’s Vaccinations in the U.S. tab now displays the count and percent of the population 12 years and older that have received a booster dose and the eligible population that has not yet received a booster dose.
- COVID Data Tracker’s Vaccinations in Dialysis Facilities tab now displays data on trends among staff and patients at dialysis facilities who received additional primary or booster doses, over time and by state.
- COVID Data Tracker’s COVID-19 Cases and Deaths by Vaccination Status tab was updated to display rates of COVID-19 cases and deaths by vaccination status and with and without a booster dose for people ages 18-49 years old and by primary series vaccine product.
- COVID Data Tracker’s COVID-19 Vaccine Effectiveness tab includes a new data source (ICATT), which includes individuals who were tested at pharmacies. New visualizations include vaccine effectiveness against infection and vaccine effectiveness against hospitalization.
- COVID-19 Vaccination Coverage and Vaccine Confidence by Sexual Orientation and Gender Identity — United States, August 29–October 30, 2021
- Notes from the Field: COVID-19 Vaccination Among Persons Living with Diagnosed HIV Infection — New York, October 2021
- SARS-CoV-2 Infection and Hospitalization Among Adults Aged ≥18 Years, by Vaccination Status, Before and During SARS-CoV-2 B.1.1.529 (Omicron) Variant Predominance — Los Angeles County, California, November 7, 2021–January 8, 2022
- Effectiveness of Face Mask or Respirator Use in Indoor Public Settings for Prevention of SARS-CoV-2 Infection — California, February–December 2021
- Clinical Characteristics and Outcomes Among Adults Hospitalized with Laboratory-Confirmed SARS-CoV-2 Infection During Periods of B.1.617.2 (Delta) and B.1.1.529 (Omicron) Variant Predominance — One Hospital, California, July 15–September 23, 2021, and December 21, 2021–January 27, 2022
Reported Cases
As of February 2, 2022, the current 7-day moving average of daily new cases (378,015) decreased 37.6% compared with the previous 7-day moving average (605,735). A total of 75,605,991 COVID-19 cases have been reported in the United States as of February 2, 2022.
Currently two variants, Omicron and Delta, are classified as Variants of Concern (VOC) in the United States. CDC Nowcast projections* for the week ending January 29, 2022, predict the national proportion of Omicron to be 99.9% (95% PI 99.9-100%) and Delta to be 0.1% (95% PI 0.0-0.1%). Omicron is predicted to be greater than 99% in all HHS regions.
There are four lineages designated as Omicron: B.1.1.529, BA.1, BA.2, and BA.3. Currently, the BA.1 lineage is predominant in the United States. CDC weighted estimates for the week ending January 15 indicate the proportion of BA.2 in the United States is less than 1%; however, the proportion of BA.2 has been steadily increasing. When the weighted estimate of BA.2 is greater than 1%, CDC NOWCAST projections will include an estimate for the proportion of BA.2 in the United States.
75,605,991
Total Cases Reported
75,605,991
Total Cases Reported
378,015
Current 7-Day Average**
378,015
Current 7-Day Average**
605,735
Prior 7-Day Average
605,735
Prior 7-Day Average
-37.6%
Change in 7-Day Average since Prior Week
-37.6%
Change in 7-Day Average since Prior Week
*The median time from specimen collection to sequence data reporting is about 3 weeks. As a result, weighted estimates for the most recent few weeks may be unstable or unavailable. CDC’s Nowcast is a data projection tool that helps fill this gap by generating timely estimates of variant proportions for variants that are circulating in the United States. View Nowcast estimates on CDC’s COVID Data Tracker website on the Variant Proportions page.
**Historical cases are excluded from daily new cases and 7-day average calculations until they are incorporated into the dataset for the applicable date. Of 399,385 historical cases reported retroactively, 136 were reported in the current week and none were reported in the prior week.
Vaccinations
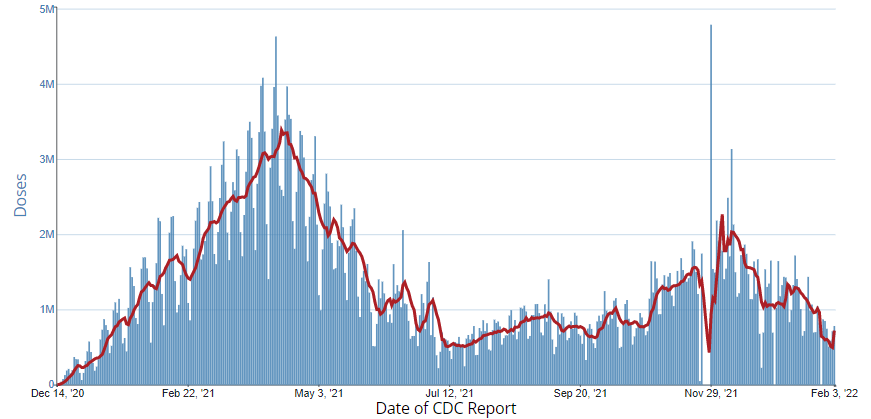
The U.S. COVID-19 Vaccination Program began December 14, 2020. As of February 3, 2022, 541.4 million vaccine doses have been administered in the United States. Overall, about 250.6 million people, or 75.5% of the total U.S. population, have received at least one dose of vaccine. About 212.3 million people, or 64.0% of the total U.S. population, have been fully vaccinated.* About 89.0 million additional or booster doses have been reported in people who have been fully vaccinated; however, 53.2% of the total booster-eligible population has not yet received a booster dose. As of February 3, 2022, the 7-day average number of administered vaccine doses reported (by date of CDC report) to CDC per day was 719,986, an 11.8% increase from the previous week.
CDC’s COVID Data Tracker Vaccination Demographic Trends tab shows vaccination trends by age group. As of February 3, 2022, 95.0% of people ages 65 years or older have received at least one dose of vaccine and 88.4% are fully vaccinated. For people ages 18 years or older, 87.1% have received at least one dose of vaccine and 74.2% are fully vaccinated. For people ages 12 years or older, 85.2% have received at least one dose of vaccine and 72.6% are fully vaccinated. For people ages 5 years or older, 80.2% have received at least one dose of vaccine and 68.0% are fully vaccinated.
541,410,847
Vaccine Doses Administered
250,593,665
People who received at least one dose
212,336,183
People who are fully vaccinated*
75.5%
Percentage of the U.S. population that has received at least one dose
64.0%
Percentage of the U.S. population that has been fully vaccinated*
+0.4
Percentage point increase from last week
+0.4
Percentage point increase from last week
*Represents the number of people who have received the second dose in a two-dose COVID-19 vaccine series (such as the Pfizer or Moderna vaccines) or one dose of the single-shot Johnson & Johnson’s Janssen vaccine.
Hospitalizations
New Hospital Admissions
The current 7-day daily average for January 26–February 1, 2022, was 16,068. This is an 18.0% decrease from the prior 7-day average (19,593) from January 19–25, 2022.
4,317,927
Total New Admissions
4,317,927
Total New Admissions
16,068
Current 7-Day Average
16,068
Current 7-Day Average
19,593
Prior 7-Day Average
19,593
Prior 7-Day Average
-18.0%
Change in 7-Day Average
-18.0%
Change in 7-Day Average
The start of consistent reporting of hospital admissions data was August 1, 2020.
Daily Trends in Number of New COVID-19 Hospital Admissions in the United States
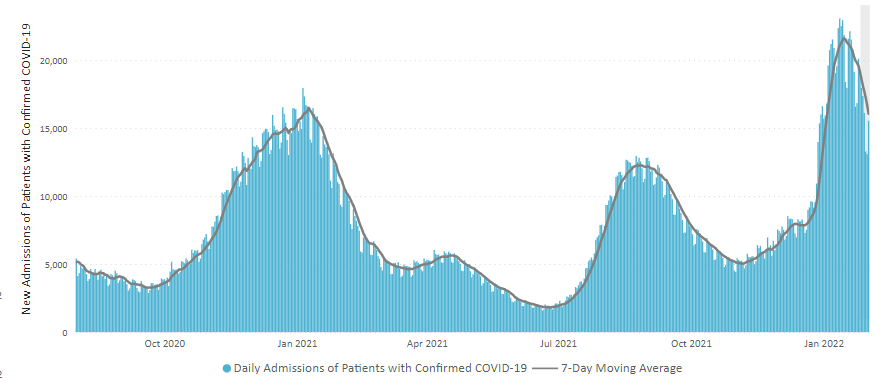
New admissions are pulled from a 10 am EST snapshot of the HHS Unified Hospital Timeseries Dataset. Due to potential reporting delays, data from the most recent 7 days, as noted in the figure above with the grey bar, should be interpreted with caution. Small shifts in historic data may also occur due to changes in the Centers for Medicare and Medicaid Services (CMS) Provider of Services file, which is used to identify the cohort of included hospitals.
COVID-NET: Trends in Overall Weekly Hospitalization Rates
CDC’s Coronavirus Disease 2019-Associated Hospitalization Surveillance Network (COVID-NET) shows that the overall weekly rates of COVID-19-associated hospitalizations in January 2022 were the highest since the beginning of the pandemic. The previous overall peak weekly hospitalization rate for the pandemic was 20.7 per 100,000 population for the week ending January 9, 2021. For the week ending January 15, 2022, overall rates of COVID-19-associated hospitalizations were 29.1 per 100,000 population, which is 40% higher than the previous peak weekly rate.
Trends in Overall Weekly Hospitalization Rates
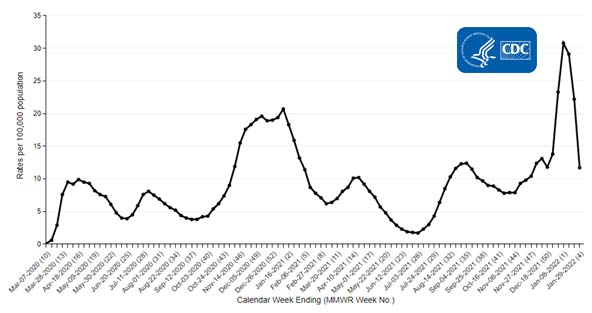
The Coronavirus Disease 2019 (COVID-19)-Associated Hospitalization Surveillance Network (COVID-NET) is an additional source for hospitalization data collected through a network of more than 250 acute-care hospitals in 14 states (representing ~10% of the U.S. population). Detailed data on patient demographics, including race/ethnicity, underlying medical conditions, medical interventions, and clinical outcomes, are collected with a standardized case reporting form.
More COVID-NET DataDeaths
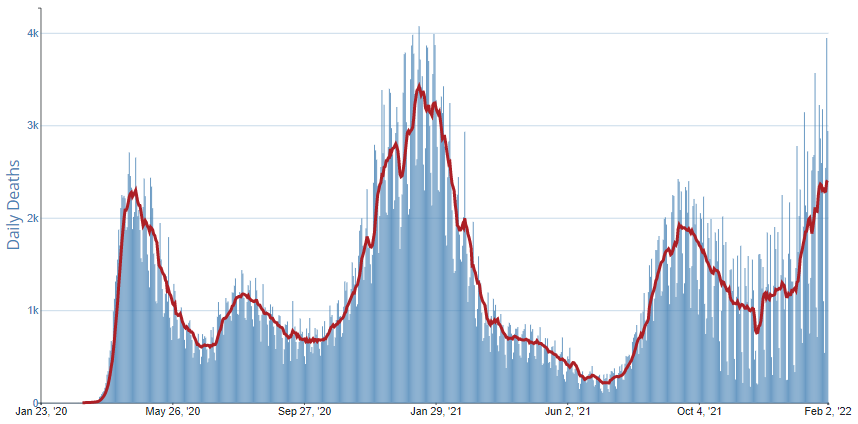
The current 7-day moving average of new deaths (2,404) has increased 1.6% compared with the previous 7-day moving average (2,366). As of February 2, 2022, a total of 892,442 COVID-19 deaths have been reported in the United States.
892,442
Total Deaths Reported
892,442
Total Deaths Reported
2,404
Current 7-Day Average*
2,404
Current 7-Day Average*
2,366
Prior 7-Day Average
2,366
Prior 7-Day Average
1.6%
Change in 7-Day Average Since Prior Week
1.6%
Change in 7-Day Average Since Prior Week
*Historical deaths are excluded from the daily new deaths and 7-day average calculations until they are incorporated into the dataset by their applicable date. Of 20,520 historical deaths reported retroactively, 192 were reported in the current week; and 347 were reported in the prior week.
Daily Trends in Number of COVID-19 Deaths in the United States Reported to CDC

7-Day moving average
 More Death Data
Testing
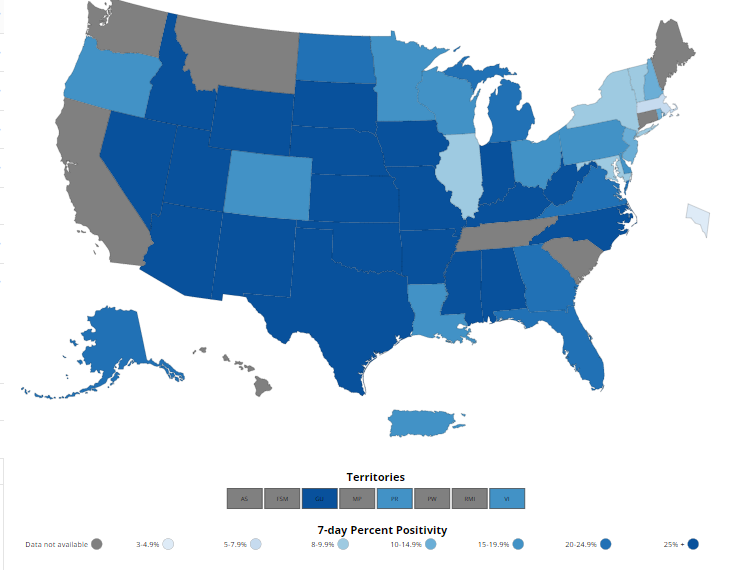
The percentage of COVID-19 NAATs (nucleic acid amplification tests)* that are positive (percent positivity) is decreasing in comparison to the previous week. The 7-day average of percent positivity from NAATs is now 18.7%. The 7-day average number of tests reported for January 21-27, 2022, was 1,720,394, down 22.5% from 2,221,284 for the prior 7 days.
785,540,430
Total Tests Reported
785,540,430
Total Tests Reported
1,720,394
7-Day Average Tests Reported
1,720,394
7-Day Average Tests Reported
18.7%
7-Day Average % Positivity
18.7%
7-Day Average % Positivity
24.5%
Previous 7-Day Average % Positivity
24.5%
Previous 7-Day Average % Positivity
-5.75
Percentage point change in 7-Day Average % Positivity since Prior Week
-5.75
Percentage point change in 7-Day Average % Positivity since Prior Week
*Test for SARS-CoV-2, the virus that causes COVID-19
A Closer Look
A Closer Look Section presents more detailed information for readers who want to learn more about current issues of interest.
Know More about Wastewater Surveillance
Estimates suggest as many as 80% of people with COVID-19 shed viral RNA in their feces, making wastewater and sewage systems an important avenue for enhancing ongoing COVID-19 surveillance efforts. In September 2020, CDC initiated the National Wastewater Surveillance System (NWSS) in response to the COVID-19 pandemic. While wastewater testing has been successfully used as a method for early detection of other diseases, such as polio, this is the first national surveillance system of its kind in the United States.
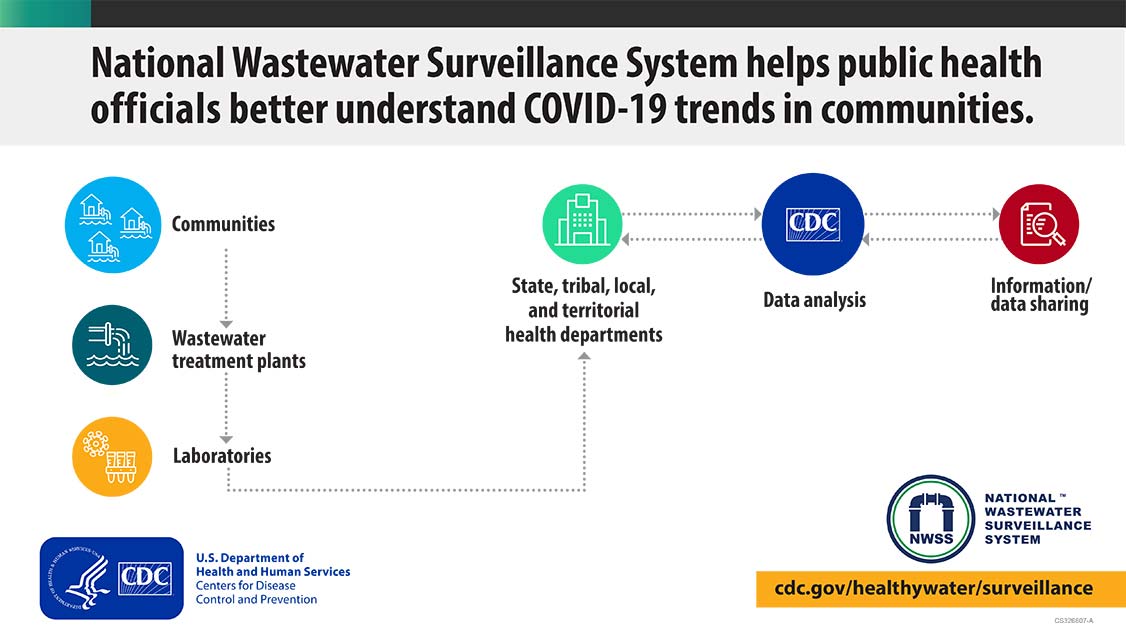
Wastewater, also referred to as sewage, includes water from household/building use, such as toilets, showers, and sinks, that can contain human fecal waste, as well as water from non-household sources, including rainwater or industrial use. Wastewater from a sewershed (community area served by a wastewater collection system) is collected for surveillance as it flows into a treatment plant. The samples collected are sent to environmental laboratories to test for SARS-CoV-2, the virus that causes COVID-19. The testing data are then submitted to participating health departments and provided to CDC through the NWSS DCIPHER portal. CDC analyzes the data in real time and reports results to the health department for use in their COVID-19 response.
Wastewater surveillance data capture the presence of both asymptomatic and symptomatic infections and are not affected by access to healthcare or availability of clinical testing. Data generated by NWSS can provide public health officials with a better understanding of COVID-19 trends in communities. Because increases of SARS-CoV-2 in wastewater generally occur 4–6 days before corresponding increases in clinical cases, wastewater surveillance can serve as an early-warning system for the emergence, or reemergence, of COVID-19 in a community. State and local health departments are using NWSS data to complement case- and symptom-based surveillance to inform public health decisions, such as where to allocate mobile testing and vaccination sites. Public health agencies have also used wastewater data to forecast changes in hospital utilization, providing additional time to mobilize resources in preparation for increasing cases.
While wastewater surveillance is a valuable tool, there are limitations that can impact the data. Interpretation of the results is limited in communities with transient populations, such as areas with high tourism. Additionally, the minimum number of individuals shedding SARS-CoV-2 into the system needed to detect a signal in wastewater is unknown, so wastewater surveillance cannot be used to determine whether a community is free from infections. For these reasons, wastewater surveillance is best used in conjunction with traditional case-based surveillance.
As of February 3, 2022, NWSS is tracking the presence of SARS-CoV-2 levels in wastewater at more than 400 testing sites across the country. NWSS participation is expected to grow as health departments and public health laboratories develop wastewater surveillance coordination, epidemiology, and laboratory capacity.

