Aquatics FAQs
Recommendations for Fully Vaccinated People
COVID-19 Homepage
Safer Communities Mean Safer Schools
Almost a year ago, as the COVID-19 pandemic started affecting our communities, schools throughout the country turned to virtual learning to help protect students, teachers, school staff, and their families. Today, schools use different strategies to prevent spread. Some teach class online, while others have opened safely and conduct in-person learning using multiple prevention strategies, even in areas with relatively high levels of community spread. Recent studies in schools that strictly followed multiple prevention strategies found that most cases in schools came from community spread of disease, not from spread within the school itself.1,2,3 This means that each community has an opportunity to help schools return to in-person learning and make them safer by making their own community safer. How do we do that?
There are three important areas where we need to focus our attention to make communities safer.
1) Prevent spread to make your community safer
CDC recently published guidance for schools that highlights the critical need for communities to reduce spread to ensure a safe return to school and other activities. Communities that reduce the level of COVID-19 spread will foster greater opportunities for schools to safely return to in-person learning. Here are 6 steps to a safer community that each of us can do:
- Wear a well-fitting mask
- Stay 6 feet apart
- Avoid gatherings
- Wash hands often
- Stay home when you are sick
- Get vaccinated when vaccine is available to you
To see data from your community, visit CDC’s COVID Data Tracker.
2) Increase testing
The number of COVID-19 tests people are getting continues to decline nationally. The average volume of tests over a seven-day period is down 20.2% from last week. Anyone who has symptoms of COVID-19 should be tested. Anyone who has been around someone with COVID-19 should also be tested. Additionally, last week the U.S. Department of Health and Human Services announcedexternal icon efforts to expand COVID-19 testing for schools and people living and gathering in group settings, such as homeless shelters. By increasing testing, we can quickly identify people who have COVID-19 and isolate them from others, take steps to prevent further spread, and better address the threat of variants.
3) Continue rapid vaccination scale-up
Vaccination rates continue to increase and as of February 25, 2021, 13.9% of the U.S. population has received one or more doses of the vaccine. Additional data were released this week to visually show how many people in each state and nationally have been vaccinated. Vaccinating more adults, including essential workers such as teachers and educational staff, is critical to curbing the pandemic.
Reported Cases
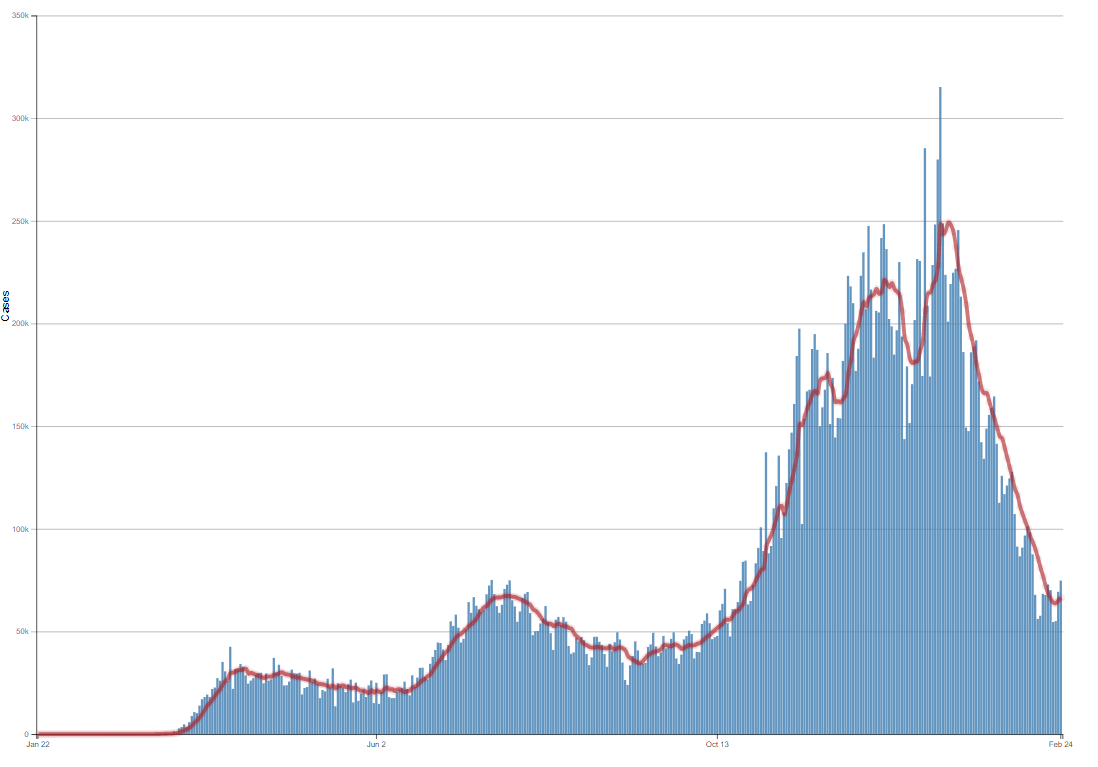
There has been a six-week downward trend in cases. The highest 7-day average of 249,303 occurred on January 11, 2021. The current 7-day average is 66,348 cases, a 73.4% decline. The 13.5% decrease in the 7-day average number of daily cases reported compared with the prior week provides an encouraging sign of recent progress. Even with these declines, the 74,806 cases reported on February 24 remains much higher than what was seen during the first peak in the pandemic.
74,806
New Cases Reported
66,348
Current 7-Day Average
28,138,938
Total Cases Reported
76,741
Prior 7-Day Average
249,303
Peak*
-13.5%
Change in 7-Day Average since Prior Week
*Highest peak for 7-day average (January 11, 2021).
Daily Trends in COVID-19 Cases in the United States Reported to CDC

7-Day moving average

SARS-CoV-2 Variants
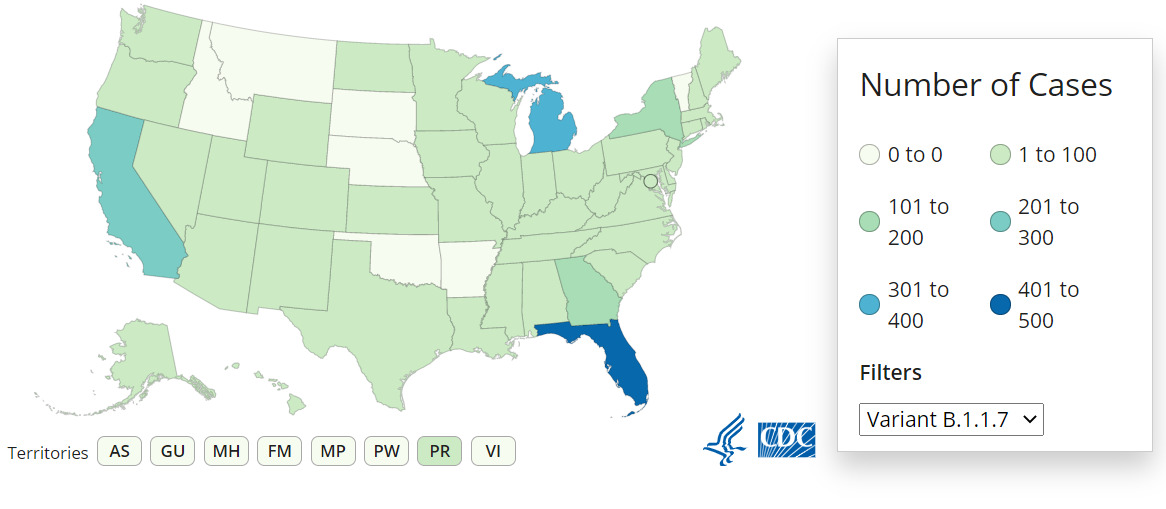
CDC is closely tracking variants of SARS-CoV-2, the virus that causes COVID-19. Three variants of concern have been detected in the United States: B.1.1.7, B.1.351, and P.1. A total of 2,102 B.1.1.7 variant cases have been reported in 45 jurisdictions. Forty-nine cases with B.1.351 in 15 jurisdictions and six cases with P.1 in five states have also been detected in the United States. CDC and partners are increasing the numbers of specimens sequenced in laboratories around the country. The number of variants reported will likely increase as more specimens are sequenced and if the frequency of variants increases. Studies are underway to determine whether variants cause more severe illness or are likely to evade immunity brought on by prior illness or vaccination.
Variant
Reported Cases in US
Number of Jurisdictions with ≥1 Case Reported
Variant
B.1.1.7
Reported Cases in US
2,102
Number of Jurisdictions with ≥1 Case Reported
45
Variant
B.1.351
Reported Cases in US
49
Number of Jurisdictions with ≥1 Case Reported
15
Variant
P.1
Reported Cases in US
6
Number of Jurisdictions with ≥1 Case Reported
5

Testing
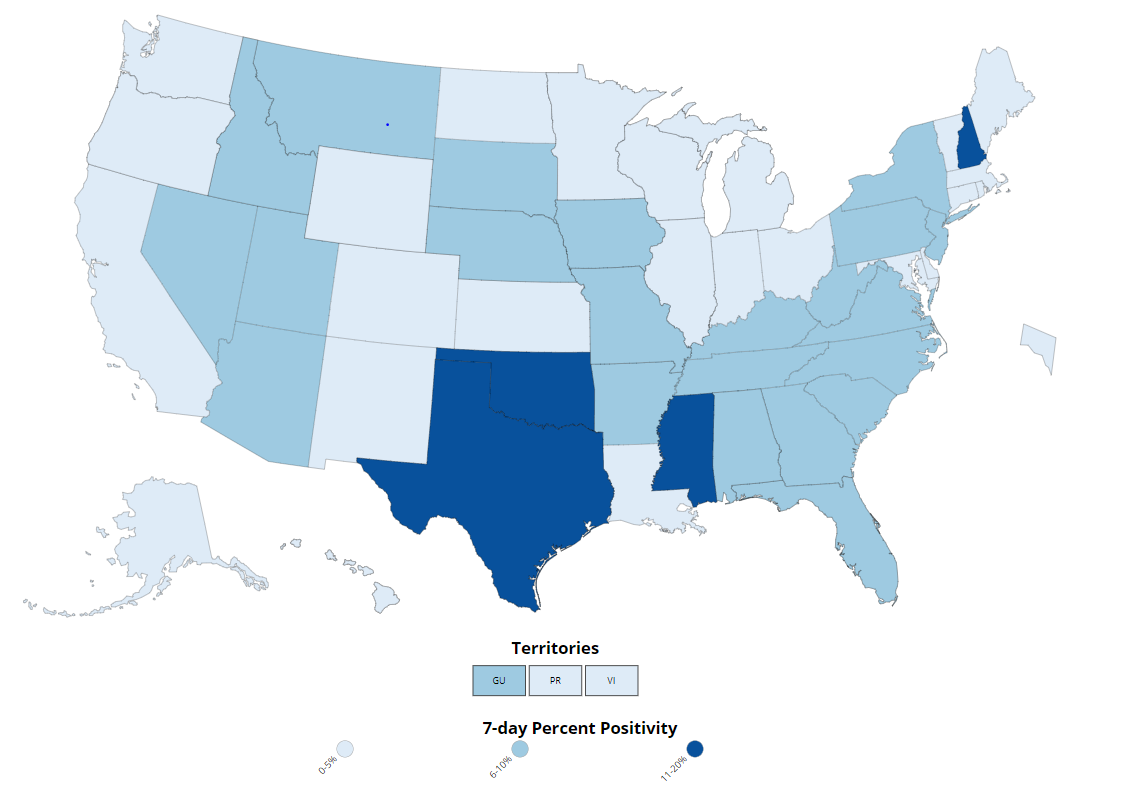
The number of COVID-19 tests that come back positive (percent positivity) continues to decline. The 7-day average of percent positivity from RT-PCR tests is now 5.2%. Four states or territories remain at 10% positivity or higher. The 7-day average test volume for February 12-18, 2021 was 1,066,213, down 20.2% from 1,335,763 the prior 7 days.
327,903,802
Total Tests Reported
1,066,213
7-Day Average Test
327,903,802
Total Tests Reported
5.2%
7-Day Average
% Positivity
1,066,213
7-Day Average Test
-14.5%
Change in 7-Day
% Positivity
COVID-19 Viral (RT-PCR) Laboratory Test 7-day Percent Positivity by State/Territory

Vaccinations
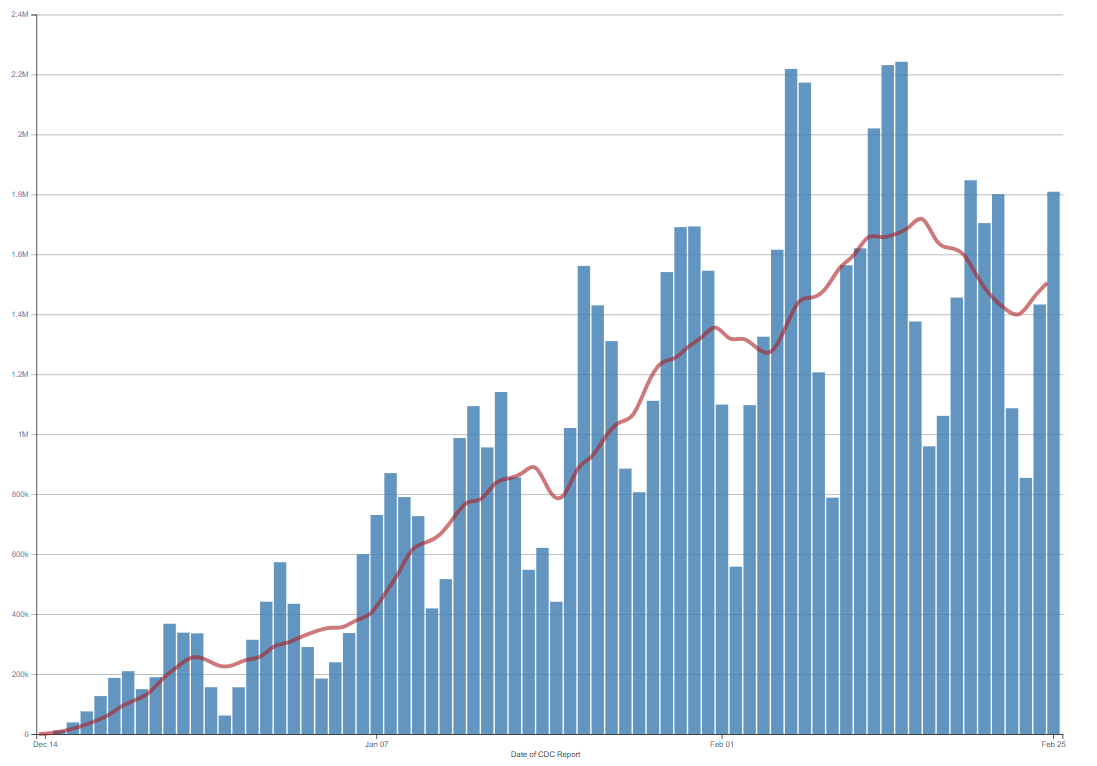
The U.S. COVID-19 Vaccination Program began December 14. As of February 25, 2021, 68.3 million vaccine doses have been administered. Overall, about 46.1 million people, or 13.9% of the U.S. population, have received at least one dose of vaccine. About 21.6 million people, or 6.5% of the U.S. population, have received two doses of vaccine. As of February 25, the 7-day average number of administered vaccine doses reported to CDC per day was 1.5 million, a 7.1% decrease from the previous week likely due to weather events.
68,274,117
Vaccines Administered
68,274,117
Vaccines Administered
46,074,392
People who received 1 or more doses
21,555,117
People who received 2 doses
Daily Change in Number of COVID-19 Vaccinations in the United States Reported to CDC
7-Day moving average

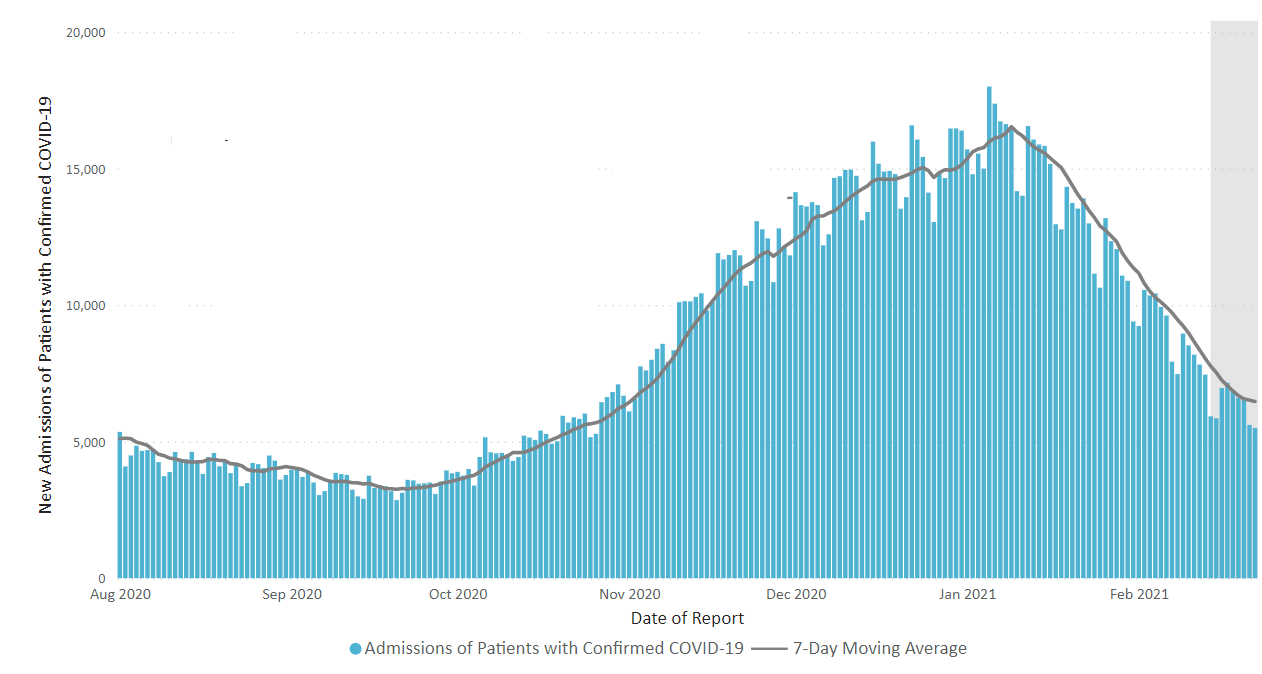
New Hospital Admissions
Hospital admissions of patients with confirmed COVID-19 decreased 61% from the national 7-day average peak of 16,536 admissions on January 9, 2021, to 6,431 admissions on February 23, 2021. The average number of daily admissions fell by 11.3%, compared to the previous week.
6,562
New Admissions
6,431
Current 7-Day Average
1,775,508
Total New Admissions
7,250
Prior 7-Day Average
16,536
Peak 7-Day Average
-11.3%
Change in 7-Day Average
Daily Trends in Number of New COVID-19 Hospital Admissions in the United States

More data.external icon The most recent data in the vertical gray bar are provisional and should be interpreted with caution.
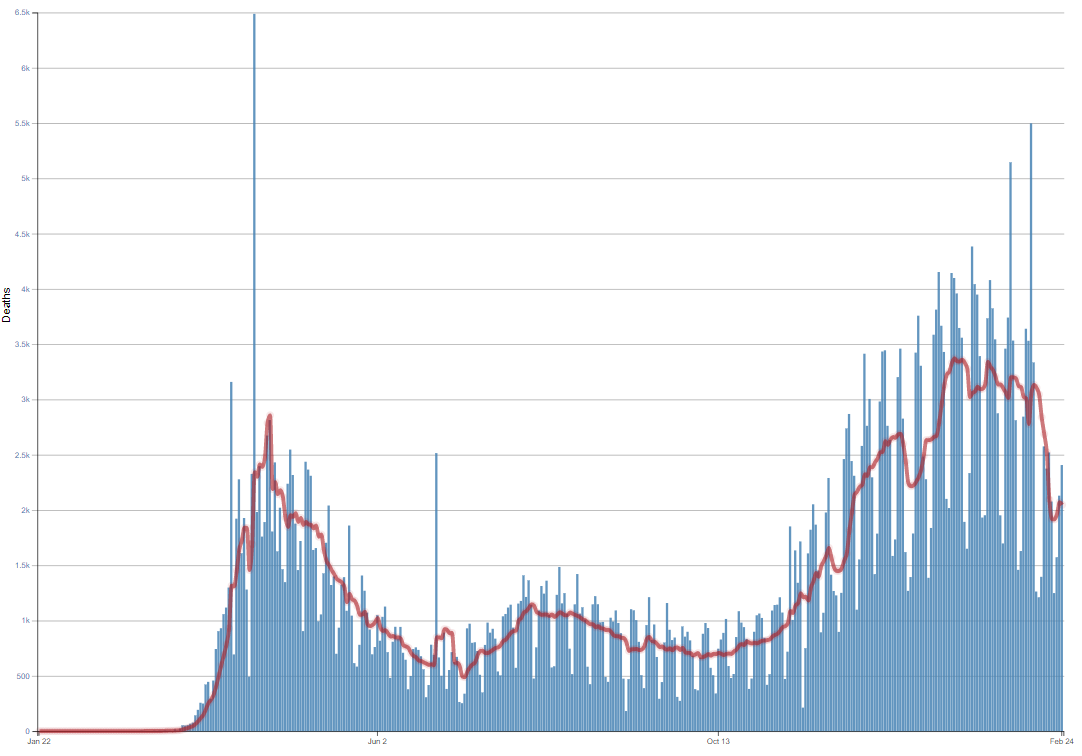
Deaths
Tragically, this week the United States passed a total of 500,000 deaths since the start of the pandemic. Nationally, the number of COVID-19 deaths continue to fluctuate. As of February 24, 2021, a total of 503,587 COVID-19 deaths were reported. The current 7-day average of deaths is 2,047 deaths, a 23.8% decrease from the previous 7-day average of 2,687 daily deaths.
2,407
New Deaths Reported
2,047
Current 7-Day Average**
503,587
Total Deaths Reported
2,687
Prior 7-Day Average**
3,373
Peak of 7-day Average*
-23.8%
Change in 7-Day Average Since Prior Week
*The most recent (highest) peak in the 7-day average of new cases (Jan 11, 2021).
** The seven-day average number of new deaths (excluding historical deaths reported in the past two weeks) decreased by 4.8% to 2,047 new deaths per day compared to the previous seven-day average of 2,150. In the current week, there were 0 historical deaths reported, and in the prior week, there were 3,763 historical deaths reported by the state of Ohio.
Daily Trends in Number of COVID-19 Deaths in the United States Reported to CDC
7-Day moving average
More Death Data
- Science Brief: Transmission of SARS-CoV-2 in K-12 schools
- Zimmerman KO, Akinboyo IC, Brookhart MA, et al. Incidence and secondary transmission of SARS-CoV-2 infections in schools.external icon Pediatrics 2021;e2020048090.
- Falk A, Benda A, Falk P, Steffen S, Wallace Z, Høeg TB. COVID-19 cases and transmission in 17 K–12 schools—Wood County, Wisconsin, August 31–November 29, 2020. MMWR Morb Mortal Wkly Rep 2021;70:136–40.
The Coronavirus Disease 2019 (COVID-19)-Associated Hospitalization Surveillance Network (COVID-NET) is an additional source for hospitalization data collected through a network of more than 250 acute-care hospitals in 14 states (representing ~10% of the U.S. population). Detailed data on patient demographics, including race/ethnicity, underlying medical conditions, medical interventions, and clinical outcomes, are collected using a standardized case reporting form.
CDC’s website also provides new data views such as county-specific summaries (under “Your Community” in Data Tracker), vaccination trends (under “Your Community” in Data Tracker), and information on SARS-CoV-2 variants.