Aquatics FAQs
Recommendations for Fully Vaccinated People
COVID-19 Homepage
In Focus: COVID-19 Community Levels
Interpretive Summary for March 4, 2022
In Focus: COVID-19 Community Levels
Last week CDC launched COVID-19 Community Levels, a new tool for helping people and communities decide on prevention steps based on the latest data. There are three levels (low, medium, high), which are determined by looking at hospital beds being used by patients with COVID-19, new hospital admissions among people with COVID-19, and the total number of new COVID-19 cases in your area. It’s easy to check your county’s level on CDC’s website and find out what actions you should take.


Medium
- If you are at high risk for severe illness, talk to your healthcare provider about whether you need to wear a mask and take other precautions
- Stay up to date with COVID-19 vaccines
- Get tested if you have symptoms

High
- Wear a mask indoors in public
- Stay up to date with COVID-19 vaccines
- Get tested if you have symptoms
- Additional precautions may be needed for people at high risk for severe illness
People may choose to mask at any time. People with symptoms, a positive test, or exposure to someone with COVID-19 should wear a mask.
The whole community can be safe only when we all take steps to protect each other, even when the COVID-19 Community Level is low or medium. No matter what your COVID-19 Community Level, layered prevention strategies can help limit severe disease and reduce the potential for strain on the healthcare system. Proven prevention steps include staying up to date on vaccines, getting tested if you have symptoms, and wearing a mask when you’re around someone at increased risk for severe COVID-19. For more information on the science behind the levels and how CDC measures them, see our A Closer Look section.
- COVID Data Tracker’s Hospitalization by Vaccination Status – COVID-NET tab was updated to display January 2022 rates of COVID-19-associated hospitalization comparing unvaccinated people, fully vaccinated people, and people with an additional or booster dose
- COVID Data Tracker’s Rates of COVID-19 Cases and Deaths by Vaccination Status tab was updated to include jurisdictional surveillance data on cases and deaths among children ages 5-11 years by vaccination status
- Safety Monitoring of COVID-19 Vaccine Booster Doses Among Persons Aged 12–17 Years — United States, December 9, 2021–February 20, 2022
- Effectiveness of COVID-19 Pfizer-BioNTech BNT162b2 mRNA Vaccination in Preventing COVID-19–Associated Emergency Department and Urgent Care Encounters and Hospitalizations Among Nonimmunocompromised Children and Adolescents Aged 5–17 Years — VISION Network, 10 States, April 2021–January 2022
- SARS-CoV-2 B.1.1.529 (Omicron) Variant Transmission Within Households — Four U.S. Jurisdictions, November 2021–February 2022
Reported Cases
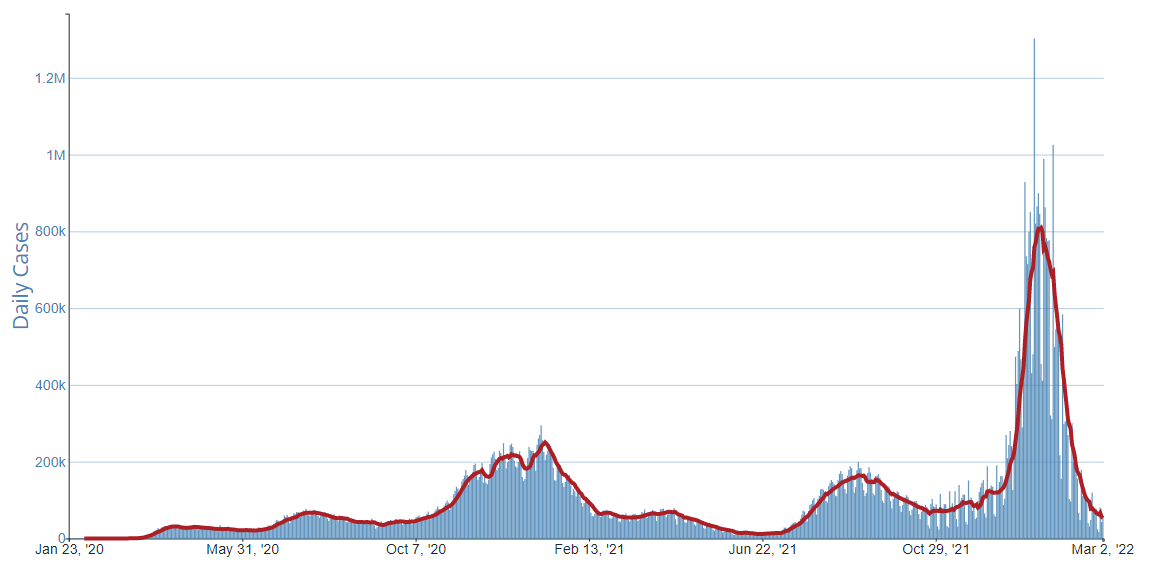
As of March 2, 2022, the current 7-day moving average of daily new cases (53,017) decreased 28.5% compared with the previous 7-day moving average (74,143). A total of 78,977,146 COVID-19 cases have been reported in the United States as of March 2, 2022.
Currently two variants, Omicron and Delta, are classified as Variants of Concern (VOC) in the United States. CDC Nowcast projections* for the week ending February 26, 2022, estimate the combined national proportion of lineages designated as Omicron to be 100%. There are five lineages designated as Omicron: B.1.1.529, BA.1, BA.1.1, BA.2, and BA.3. COVID Data Tracker now shows the proportions of the B.1.1.529 lineage (includes BA.1 and BA.3), BA.1.1** lineage, and the BA.2 lineage. The predominant Omicron lineage in the United States is BA.1.1, which is descendent of the BA.1 lineage and is characterized by an additional substitution (R346K) in the spike protein. The national proportion of BA.1.1 is projected to be 74.6% (95% PI 70.3-78.4%). B.1.1.529 (BA.1 and BA.3) is projected to be 17.2% (95% PI 14.1-20.8%) and BA.2 is projected to be 8.3% (95% PI 6.3-10.7%). Delta is projected to continue to be 0.0% (95% PI 0.0-0.0%). Omicron is predicted to be 100% in all HHS regions.
78,977,146
Total Cases Reported
53,017
Current 7-Day Average**
74,143
Prior 7-Day Average
-28.5%
Change in 7-Day Average since Prior Week
*The median time from specimen collection to sequence data reporting is about 3 weeks. As a result, weighted estimates for the most recent few weeks may be unstable or unavailable. CDC’s Nowcast is a data projection tool that helps fill this gap by generating timely estimates of variant proportions for variants that are circulating in the United States. View Nowcast estimates on CDC’s COVID Data Tracker website on the Variant Proportions page.
**For national data, the proportion of BA.1.1 is shown separately. For regional data, the proportion of BA.1.1 is also aggregated with B.1.1.529.
***Historical cases are excluded from daily new cases and 7-day average calculations until they are incorporated into the dataset for the applicable date. Of 451,214 historical cases reported retroactively, 27,211 were reported in the current week and 676 were reported in the prior week.
Daily Trends in COVID-19 Cases in the United States Reported to CDC

7-Day moving average

Vaccinations
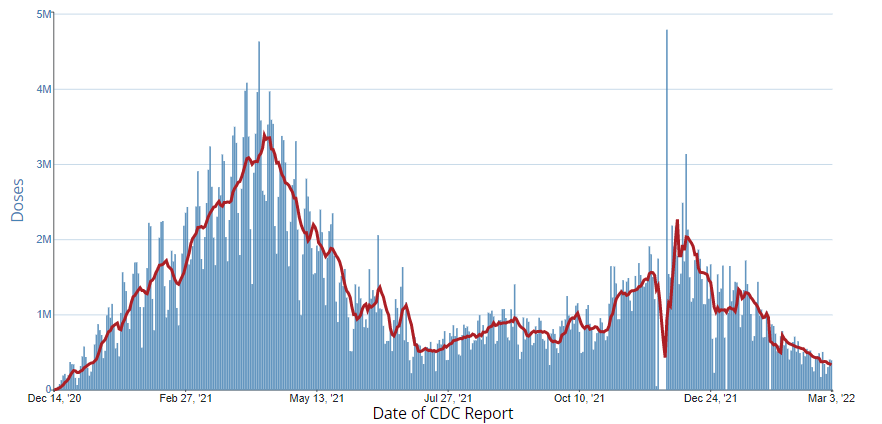
The U.S. COVID-19 Vaccination Program began December 14, 2020. As of March 2, 2022, 553.8 million vaccine doses have been administered in the United States. Overall, about 253.8 million people, or 76.4% of the total U.S. population, have received at least one dose of vaccine. About 215.8 million people, or 65.0% of the total U.S. population, have been fully vaccinated.* About 94.6 million additional or booster doses have been reported in people who have been fully vaccinated; however, 49.9% of the total booster-eligible population has not yet received a booster dose. As of March 2, 2022, the 7-day average number of administered vaccine doses reported (by date of CDC report) to CDC per day was 168,660, a 46.9% decrease from the previous week.
CDC’s COVID Data Tracker Vaccination Demographic Trends tab shows vaccination trends by age group and by race/ethnicity. As of March 2, 2022, 95.0% of people ages 65 years or older have received at least one dose of vaccine and 88.8% are fully vaccinated. For people ages 5-11 years, only 26.0% are fully vaccinated. For people ages 5 years or older, 81.2% have received at least one dose of vaccine and 69.1% are fully vaccinated. Of the fully vaccinated population, people ages 75 years or older have the highest proportion of additional/booster doses (68.6%) while people ages 12-17 have the lowest proportion (21.4%).
As of March 2, 2022, of all race/ethnicity groups, the Asian non-Hispanic population has the highest proportion that is fully vaccinated (59.9%) and the Black non-Hispanic population has the lowest proportion that is fully vaccinated (40.8%). Of the fully vaccinated population, the Asian non-Hispanic population has the highest proportion of additional/booster doses (66.0%) while the Hispanic/Latino population has the lowest proportion (39.1%).
COVID Data Tracker’s COVID-19 Vaccination Equity tab shows vaccination trends by urban/rural status. As of March 2, 2022, 48.6% of people in rural counties are fully vaccinated, while the range of vaccination coverage in the 4 urban/metro counties ranged from 53.9% (small metro) to 66.2% (large central metro).
553,778,476
Vaccine Doses Administered
253,752,684
People who received at least one dose
215,775,839
People who are fully vaccinated*
76.4%
Percentage of the U.S. population that has received at least one dose
65.0%
Percentage of the U.S. population that has been fully vaccinated*
+0.1
Percentage point increase from last week
+0.2
Percentage point increase from last week
*Represents the number of people who have received the second dose in a two-dose COVID-19 vaccine series (such as the Pfizer or Moderna vaccines) or one dose of the single-shot Johnson & Johnson’s Janssen vaccine.
Daily Change in the Total Number of Administered COVID-19 Vaccine Doses Reported to CDC by the Date of CDC Report, United States
7-Day moving average

Hospitalizations
New Hospital Admissions
The current 7-day daily average for February 23-March 1, 2022, was 4,243. This is a 30.3% decrease from the prior 7-day average (6,089) from February 16-February 22, 2022.
4,536,834
Total New Admissions
4,243
Current 7-Day Average
6,089
Prior 7-Day Average
-30.3%
Change in 7-Day Average
The start of consistent reporting of hospital admissions data was August 1, 2020.
Daily Trends in Number of New COVID-19 Hospital Admissions in the United States

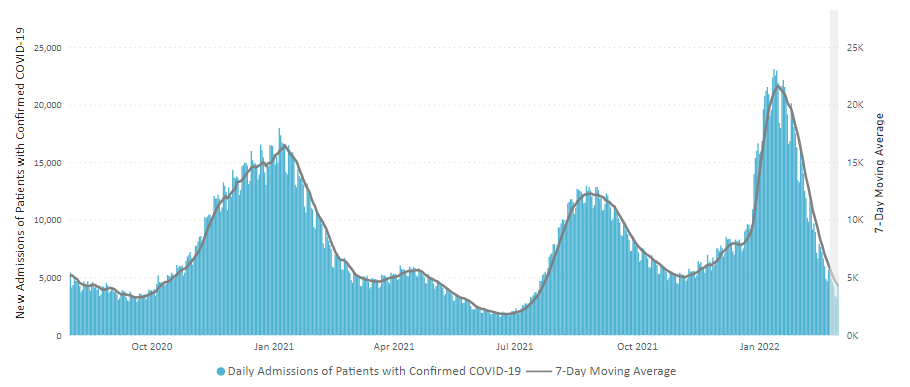
New admissions are pulled from a 10 am EST snapshot of the HHS Unified Hospital Timeseries Dataset. Due to potential reporting delays, data from the most recent 7 days, as noted in the figure above with the grey bar, should be interpreted with caution. Small shifts in historic data may also occur due to changes in the Centers for Medicare and Medicaid Services (CMS) Provider of Services file, which is used to identify the cohort of included hospitals.
Hospitalization Rates by Vaccination Status in Adults
CDC’s Coronavirus Disease 2019-Associated Hospitalization Surveillance Network (COVID-NET) shows that rates of COVID-19-associated hospitalizations in January 2022 remained higher in unvaccinated adults compared to fully vaccinated adults who have received additional or booster doses of a COVID-19 vaccine. Among adults ages 18 years and older, the COVID-19-associated hospitalization rate in January among unvaccinated persons was 9 times as high as the rate among fully vaccinated adults who received an additional or booster dose. Compared with adults who received additional or booster doses, rates of COVID-19-associated hospitalization remain higher among unvaccinated adults, regardless of age group.
Age-Adjusted Rates of COVID-19-Associated Hospitalizations among Adults Ages ≥18 Years, by Vaccination Status

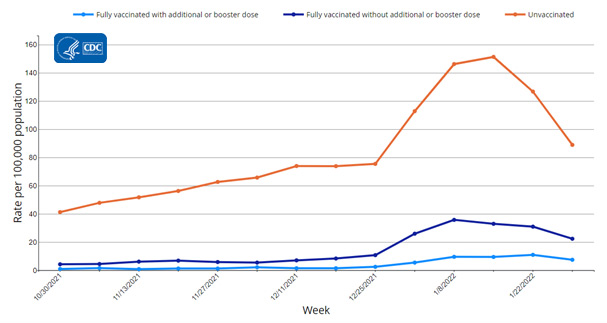
The Coronavirus Disease 2019 (COVID-19)-Associated Hospitalization Surveillance Network (COVID-NET) is an additional source for hospitalization data collected through a network of more than 250 acute-care hospitals in 14 states (representing ~10% of the U.S. population). Detailed data on patient demographics, including race/ethnicity, underlying medical conditions, medical interventions, and clinical outcomes, are collected with a standardized case reporting form.
More COVID-NET DataDeaths
The current 7-day moving average of new deaths (1,559) has decreased 8.9% compared with the previous 7-day moving average (1,712). As of March 2, 2022, a total of 952,223 COVID-19 deaths have been reported in the United States.
952,223
Total Deaths Reported
1,559
Current 7-Day Average*
1,712
Prior 7-Day Average
-8.9%
Change in 7-Day Average Since Prior Week
*Historical deaths are excluded from the daily new deaths and 7-day average calculations until they are incorporated into the dataset by their applicable date. Of 20,882 historical deaths reported retroactively, none were reported in the current week; and none were reported in the prior week.
Daily Trends in Number of COVID-19 Deaths in the United States Reported to CDC
7-Day moving average
 More Death Data
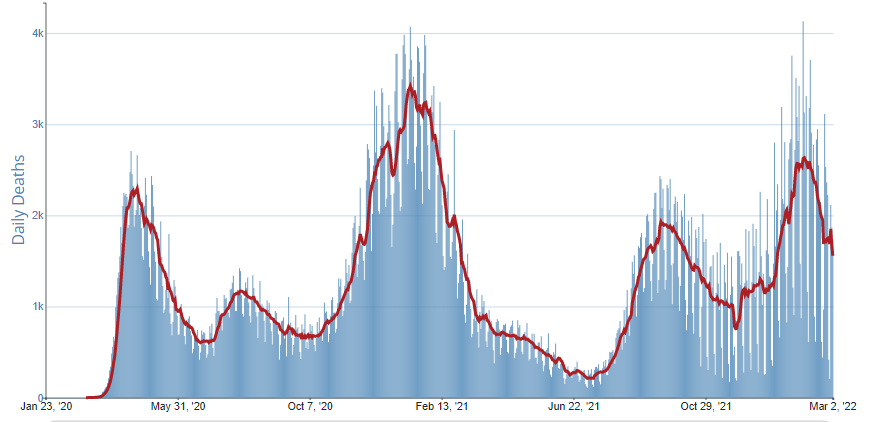
Testing
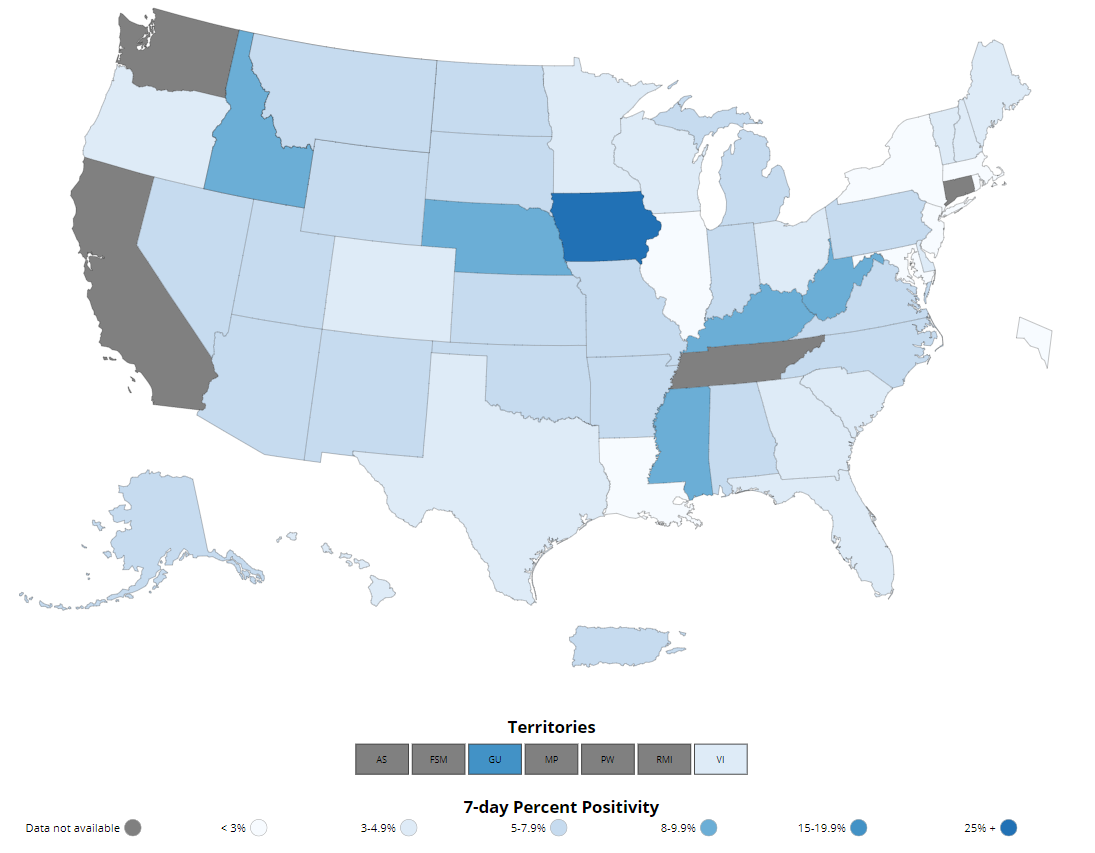
The percentage of COVID-19 NAATs (nucleic acid amplification tests)* that are positive (percent positivity) is decreasing in comparison to the previous week. The 7-day average of percent positivity from NAATs is now 3.8%. The 7-day average number of tests reported for February 18-24, 2022, was 1,008,290, down 15.7% from 1,195,808 for the prior 7 days.
821,443,122
Total Tests Reported
821,443,122
Total Tests Reported
1,008,290
7-Day Average Tests Reported
3.8%
7-Day Average % Positivity
821,443,122
Total Tests Reported
5.5%
Previous 7-Day Average % Positivity
-1.65
Percentage point change in 7-Day Average % Positivity since Prior Week
*Test for SARS-CoV-2, the virus that causes COVID-19
COVID-19 NAAT Laboratory Test 7-day Percent Positivity by State/Territory

A Closer Look
This section presents more detailed information for readers who want to learn more about current issues of interest.
Understanding the COVID-19 Community Levels
At this point in the pandemic, the United States has high rates of vaccine and infection-induced immunity in the population, as well as availability of effective therapeutics, testing, and well-fitting masks/respirators. These tools, which have been developed and distributed over the past two years, mean that we can minimize medically significant disease and prevent excessive strain on the healthcare sector even while SARS-CoV-2 virus continues to circulate. CDC has introduced the COVID-19 Community Levels to monitor the impact of COVID-19 on communities. While we do not know how the spread of SARS-CoV-2 virus might change in the future (e.g., from the emergence of a new variant), the COVID-19 Community Levels will inform how prevention measures could be used to minimize the impact of COVID-19 on health and society.
The COVID-19 Community Levels considers three measurements that provide a better picture than the previously used Community Transmission metric of the current impact of COVID-19 while also serving as clear predictors of how the situation could change:
- New COVID-19 hospital admissions per 100,000 population in the last 7 days, which reflects the amount of severe COVID-19 disease within the community
- Percent of staffed inpatient beds occupied by patients with confirmed COVID-19 (7-day average), an indicator of local healthcare system usage and remaining capacity to care for patients with other medically important health issues
- New COVID-19 cases per 100,000 population in the last 7 days, a signal of anticipated healthcare strain. An increase over a threshold of 200 cases per 100,000 population may forecast increases in new hospitalizations or inpatient beds occupied by COVID-19 patients and helps communities to implement prevention strategies accordingly.
These three measures were chosen because they 1) monitor severe illness and healthcare strain caused from COVID-19, 2) are available for all counties across the country, from data reported at the county level or allocated to the county level from Health Services Areas (HSAs), and 3) are reported frequently enough to inform decisions about recommended prevention strategies in a timely manner. The data used to inform the COVID-19 Community Levels indicators are available through the U.S. Department of Health and Human Services Unified Hospital Data Surveillance System (UHDSS), which monitors national and local trends in healthcare system stress, capacity, and community disease levels for approximately 6,000 hospitals in the United States. Case incidence rate is determined from aggregate counts of COVID-19 cases reported by state and territorial jurisdictions to the CDC.
The thresholds for each COVID-19 Community Level were selected after a series of analyses examining the performance of different thresholds and combinations of thresholds to predict serious health outcomes. They were then validated through discussion with and inputs from local and state health officials and experts from hospital and healthcare systems. These thresholds are designed to signal the need for additional precautions in time for them to make a difference and allow communities to scale back those precautions when the Community Level is low. Our analyses showed that the COVID-19 Community Levels provide a sizeable improvement over community transmission levels in identifying regions that will experience severe outcomes—including ICU admissions and deaths—in the weeks ahead. Additional details about the methods for setting and evaluating the COVID-19 Community Levels are available here.
Health officials and individuals can use the COVID-19 Community Levels to inform decisions about community prevention strategies and individual behaviors. Individuals should also make personal decisions based on whether they are at high risk for severe disease. Exploring ways to promote these prevention strategies and provide equitable access to vaccines and other resources in our communities will protect the health and safety of everyone.