Aquatics FAQs
Recommendations for Fully Vaccinated People
COVID-19 Homepage
Boosted is Best
Interpretive Summary for March 18, 2022
Boosted is Best

COVID-19 cases, hospitalizations, and deaths all continue to decrease in the United States. According to CDC’s COVID Data Tracker, as of March 16, 2022, 76.7% of the total U.S. population has received at least one dose of a COVID-19 vaccine, and 65.3% has completed their primary series. However, only about half of the booster-eligible population has received a booster dose and is considered up to date on their COVID-19 vaccines.
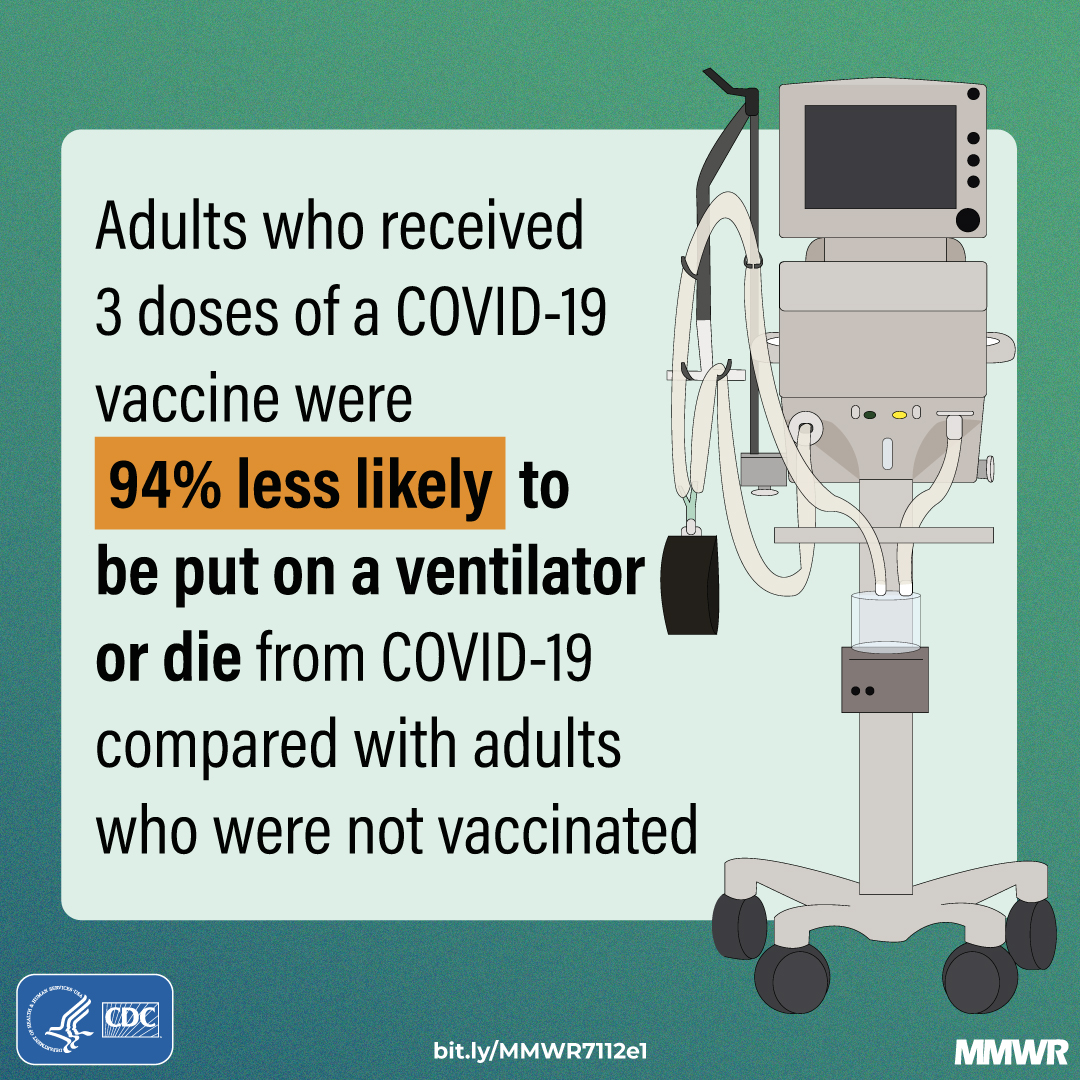
Two new studies show the effectiveness of COVID-19 vaccines and boosters across periods of three variants of concern (Alpha, Delta, and Omicron). CDC released a study today showing that, among adults hospitalized with COVID-19 during the Delta and Omicron waves, those who received two or three doses of the Pfizer-BioNTech or Moderna vaccine had 90–95% less risk of dying or needing a ventilator compared with adults who were not vaccinated. Protection was highest in adults who received a third COVID-19 vaccine dose. A study published in the British Medical Journalexternal icon found that vaccines gave a high level of protection against hospitalization for all variants, but not as much for Omicron among adults who received only a primary series. However, boosters increased protection against Omicron. The study also showed that hospital patients who were vaccinated had much lower disease severity than patients who were not vaccinated.
These studies emphasize the importance of staying up to date with vaccinations—they are our best protection against severe COVID-19 illness. Vaccination is also the safest way to reduce the chance that new variants will emerge. Find a vaccine provider and get your booster dose as soon as you can.*
*People who are moderately or severely immunocompromised have specific COVID-19 vaccine recommendations for the primary series and booster dose due to their different immune response following COVID-19 vaccination. For more information, visit CDC’s website.
- COVID Data Tracker’s Cases and Deaths by Vaccination Status tab was updated to include booster dose data for the populations 12-17 years.
- COVID Data Tracker’s Vaccination Demographic Trends tab was updated to allow users to select a jurisdiction when viewing the Age Group and Sex tab on the “Booster Vaccination Trends” dashboard.
- Hospitalization of Infants and Children Aged 0–4 Years with Laboratory-Confirmed COVID-19 — COVID-NET, 14 States, March 2020–February 2022
- Effectiveness of 2-Dose BNT162b2 (Pfizer BioNTech) mRNA Vaccine in Preventing SARS-CoV-2 Infection Among Children Aged 5–11 Years and Adolescents Aged 12–15 Years — PROTECT Cohort, July 2021–February 2022
- The Advisory Committee on Immunization Practices’ Recommendation for Use of Moderna COVID-19 Vaccine in Adults Aged ≥18 Years and Considerations for Extended Intervals for Administration of Primary Series Doses of mRNA COVID-19 Vaccines — United States, February 2022
- Effectiveness of mRNA Vaccination in Preventing COVID-19–Associated Invasive Mechanical Ventilation and Death — United States, March 2021–January 2022
- COVID-19–Associated Hospitalizations Among Adults During SARS-CoV-2 Delta and Omicron Variant Predominance, by Race/Ethnicity and Vaccination Status — COVID-NET, 14 States, July 2021–January 2022
Reported Cases
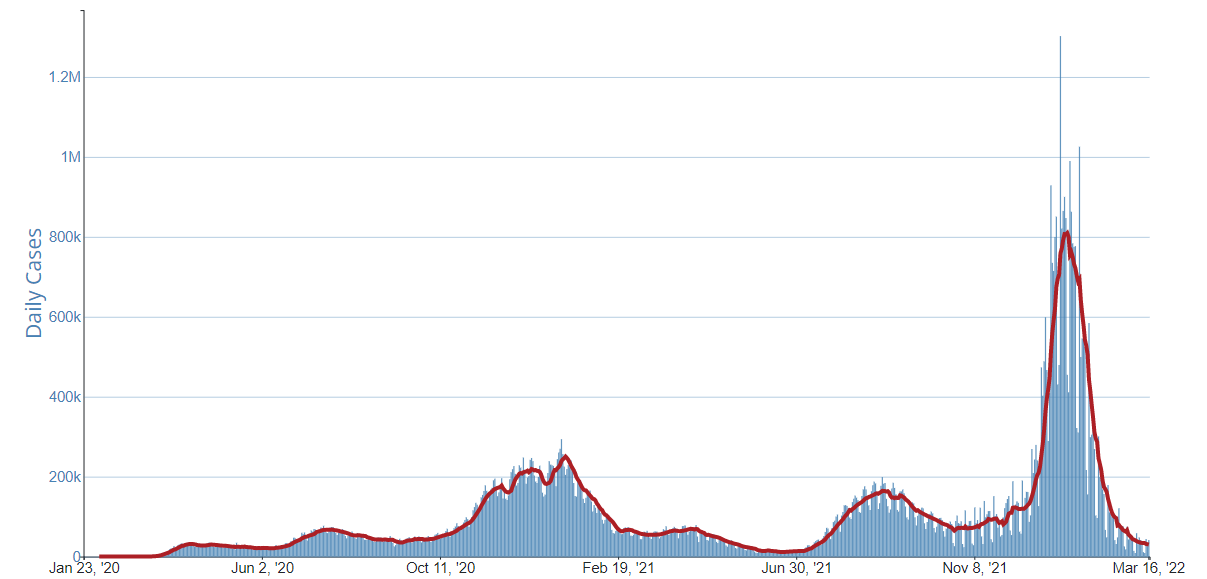
As of March 16, 2022, the current 7-day moving average of daily new cases (30,040) decreased 16.6% compared with the previous 7-day moving average (36,010). A total of 79,486,762 COVID-19 cases have been reported in the United States as of March 16, 2022.
Currently two variants, Omicron and Delta, are classified as Variants of Concern (VOC) in the United States. CDC Nowcast projections* for the week ending March 12, 2022, estimate the combined national proportion of lineages designated as Omicron to be 100%. There are five lineages designated as Omicron: B.1.1.529, BA.1, BA.1.1, BA.2, and BA.3. COVID Data Tracker shows the proportions of the B.1.1.529 lineage (includes BA.1 and BA.3), the BA.1.1** lineage, and the BA.2 lineage. The predominant Omicron lineage in the United States is BA.1.1. The national proportion of BA.1.1 is projected to be 66.1% (95% PI 60.6-71.1%). B.1.1.529 (BA.1 and BA.3) is projected to be 10.8% (95% PI 9.1-12.8%) and BA.2 is projected to be 23.1% (95% PI 18.6-28.3%). Delta is projected to continue to be 0.0% (95% PI 0.0-0.0%). Omicron is predicted to be 100% in all HHS regions.
79,486,762
Total Cases Reported
30,040
Current 7-Day Average**
36,010
Prior 7-Day Average
-16.6%
Change in 7-Day Average since Prior Week
*The median time from specimen collection to sequence data reporting is about 3 weeks. As a result, weighted estimates for the most recent few weeks may be unstable or unavailable. CDC’s Nowcast is a data projection tool that helps fill this gap by generating timely estimates of variant proportions for variants that are circulating in the United States. View Nowcast estimates on CDC’s COVID Data Tracker website on the Variant Proportions page.
**For national data, the proportion of BA.1.1 is shown separately. For regional data, the proportion of BA.1.1 is also aggregated with B.1.1.529.
***Historical cases are excluded from daily new cases and 7-day average calculations until they are incorporated into the dataset for the applicable date. Of 482,816 historical cases reported retroactively, 23,220 were reported in the current week and 8,517 were reported in the prior week.
Daily Trends in COVID-19 Cases in the United States Reported to CDC

7-Day moving average

Vaccinations
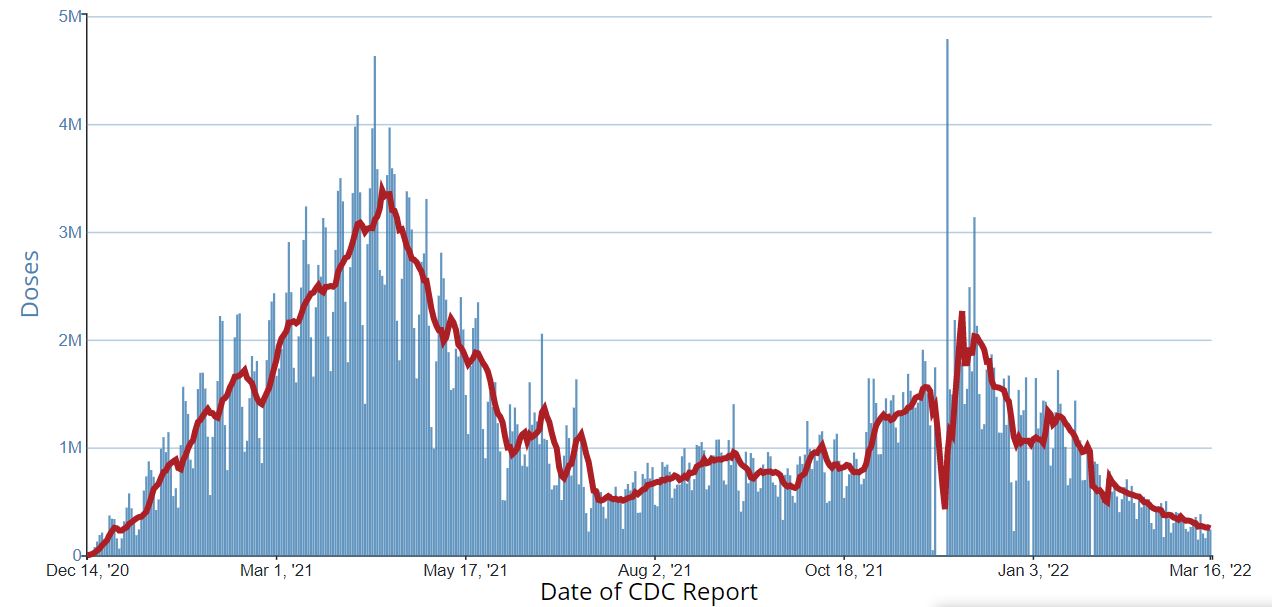
The U.S. COVID-19 Vaccination Program began December 14, 2020. As of March 16, 2022, 557.6 million vaccine doses have been administered in the United States. Overall, about 254.8 million people, or 76.7% of the total U.S. population, have received at least one dose of vaccine. About 216.8 million people, or 65.3% of the total U.S. population, have been fully vaccinated.* About 96.2 million additional or booster doses have been reported in people who have been fully vaccinated; however, 49.9% of the total booster-eligible population has not yet received a booster dose. As of March 16, 2022, the 7-day average number of administered vaccine doses reported (by date of CDC report) to CDC per day was 249,521, a 17.6% decrease from the previous week.
CDC’s COVID Data Tracker Vaccination Demographic Trends tab shows vaccination trends by age group and by race/ethnicity. As of March 16, 2022, 95.0% of people ages 65 years or older have received at least one dose of vaccine and 88.9% are fully vaccinated. For people ages 5–11 years, only 26.9% are fully vaccinated. For people ages 5 years or older, 81.6% have received at least one dose of vaccine and 69.4% are fully vaccinated. Of the fully vaccinated population, people ages 75 years or older have the highest proportion of additional/booster doses (69.1%) while people ages 12–17 have the lowest proportion (22.5%).
As of March 16, 2022, of all race/ethnicity groups, the Asian non-Hispanic population has the highest proportion that is fully vaccinated (60.2%), and the Black non-Hispanic population has the lowest proportion that is fully vaccinated (41.1%). Of the fully vaccinated population, the Asian non-Hispanic population has the highest proportion of additional/booster doses (66.9%), while the Hispanic/Latino population has the lowest proportion (40.1%).
COVID Data Tracker’s COVID-19 Vaccination Equity tab shows vaccination trends by urban/rural status. As of March 16, 2022, 48.8% of people in rural counties are fully vaccinated, while the range of vaccination coverage in the 4 urban/metro counties ranged from 52.7% (micropolitan) to 66.6% (large central metro).
557,644,629
Vaccine Doses Administered
254,750,626
People who received at least one dose
216,829,829
People who are fully vaccinated*
76.7%
Percentage of the U.S. population that has received at least one dose
65.3%
Percentage of the U.S. population that has been fully vaccinated*
+0.1
Percentage point increase from last week
+0.1
Percentage point increase from last week
*Represents the number of people who have received the second dose in a two-dose COVID-19 vaccine series (such as the Pfizer-BioNTech or Moderna vaccines) or one dose of the single-shot Johnson & Johnson’s Janssen vaccine.
Daily Change in the Total Number of Administered COVID-19 Vaccine Doses Reported to CDC by the Date of CDC Report, United States
7-Day moving average

Hospitalizations
New Hospital Admissions
The current 7-day daily average for March 9–15, 2022, was 2,298. This is a 27.2% decrease from the prior 7-day average (3,157) from March 2–8, 2022.
4,575,344
Total New Admissions
2,298
Current 7-Day Average
3,157
Prior 7-Day Average
-27.2%
Change in 7-Day Average
The start of consistent reporting of hospital admissions data was August 1, 2020.
Daily Trends in Number of New COVID-19 Hospital Admissions in the United States

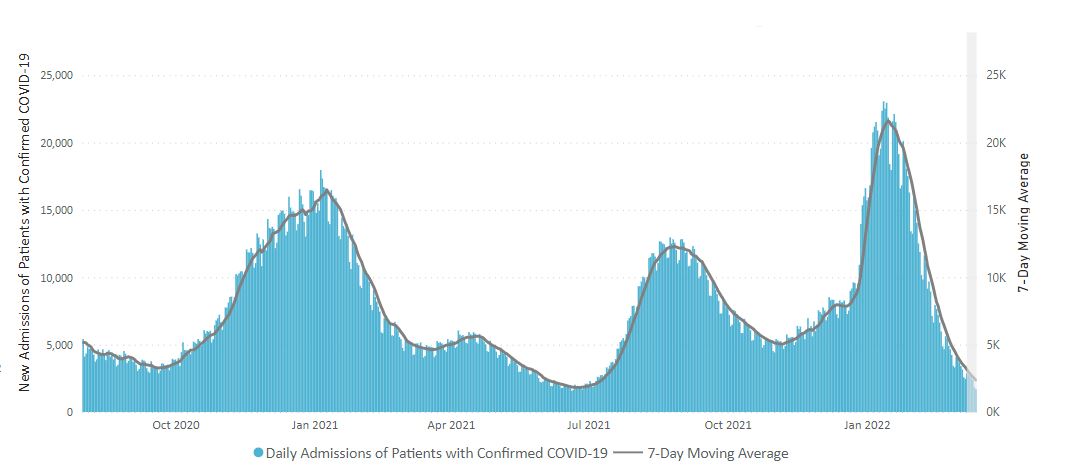
New admissions are pulled from a 10 am EDT snapshot of the HHS Unified Hospital Timeseries Dataset. Due to potential reporting delays, data from the most recent 7 days, as noted in the figure above with the grey bar, should be interpreted with caution. Small shifts in historic data may also occur due to changes in the Centers for Medicare and Medicaid Services (CMS) Provider of Services file, which is used to identify the cohort of included hospitals.
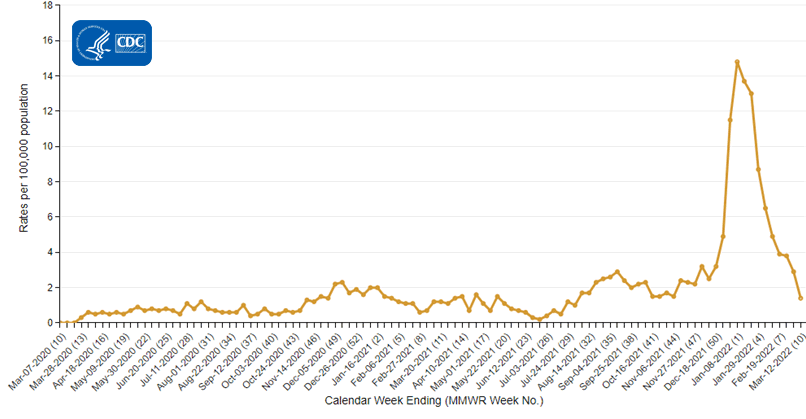
COVID-NET: Trends in Hospitalization Rates in Children Ages 4 Years and Younger
CDC’s Coronavirus Disease 2019-Associated Hospitalization Surveillance Network (COVID-NET) shows that for the week ending February 26, 2022, the rate of COVID-19-associated hospitalizations for children ages 4 years and younger, who are not eligible for vaccination, is 3.8 per 100,000. The weekly rate of hospitalizations in this group has decreased from its peak of 14.8 in early January 2022. However, these rates remain elevated compared to rates observed in this age group before the start of the period of Omicron variant predominance in late December 2021.
Additional clinical and demographic information for COVID-19-associated hospitalizations among children ages 4 years and younger can be found in a new report using COVID-NET data here.
Weekly Rates of COVID-19-Associated Hospitalization among Children Ages 4 Years and Younger

The Coronavirus Disease 2019 (COVID-19)-Associated Hospitalization Surveillance Network (COVID-NET) is an additional source for hospitalization data collected through a network of more than 250 acute-care hospitals in 14 states (representing ~10% of the U.S. population). Detailed data on patient demographics, including race/ethnicity, underlying medical conditions, medical interventions, and clinical outcomes, are collected with a standardized case reporting form.
More COVID-NET DataDeaths
The current 7-day moving average of new deaths (1,052) has decreased 11.4% compared with the previous 7-day moving average (1,188). As of March 16, 2022, a total of 965,575 COVID-19 deaths have been reported in the United States.
965,575
Total Deaths Reported
1,052
Current 7-Day Average*
1,188
Prior 7-Day Average
-11.4%
Change in 7-Day Average Since Prior Week
*Historical deaths are excluded from the daily new deaths and 7-day average calculations until they are incorporated into the dataset by their applicable date. Of 20,882 historical deaths reported retroactively, none were reported in the current week; and none were reported in the prior week.
Daily Trends in Number of COVID-19 Deaths in the United States Reported to CDC
7-Day moving average
 More Death Data
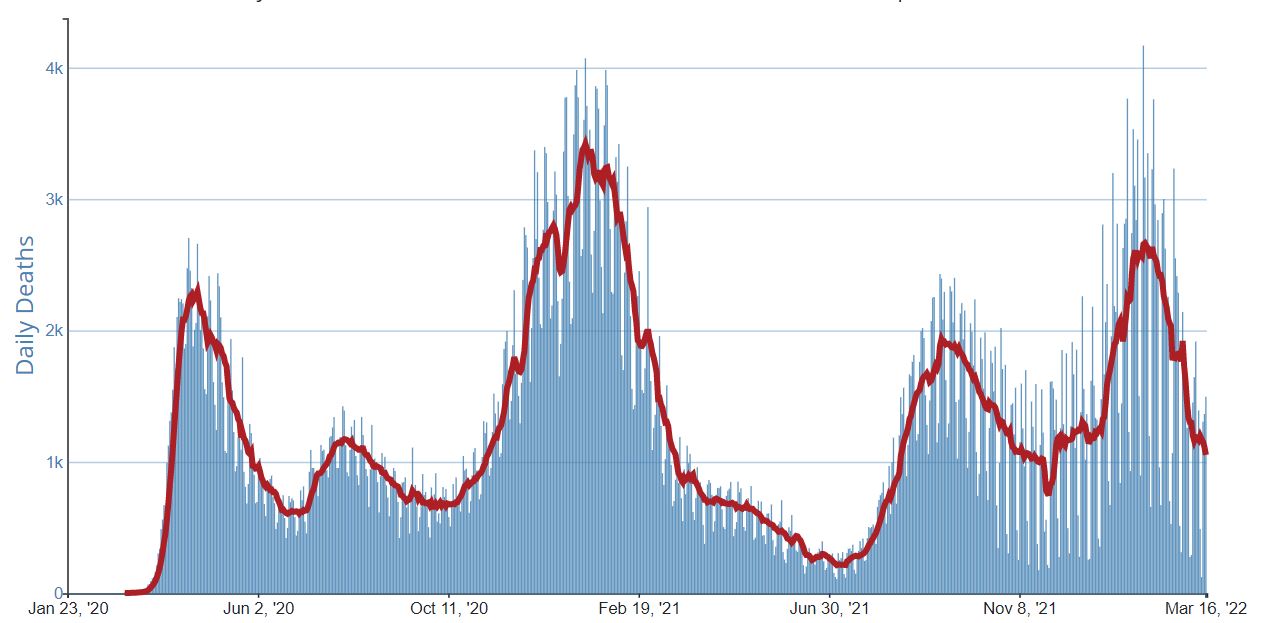
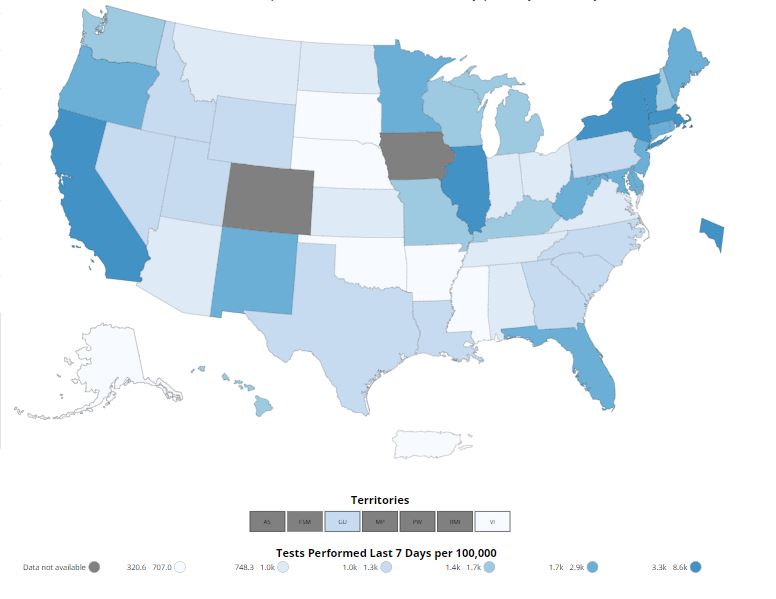
Testing
The percentage of COVID-19 NAATs (nucleic acid amplification tests)* that are positive (percent positivity) is decreasing in comparison to the previous week. The 7-day average of percent positivity from NAATs is now 2.2%. The 7-day average number of tests reported for March 4–10, 2022, was 858,144 down 11.2% from 966,600 for the prior 7 days.
834,241,390
Total Tests Reported
834,241,390
Total Tests Reported
858,144
7-Day Average Tests Reported
2.2%
7-Day Average % Positivity
834,241,390
Total Tests Reported
2.8%
Previous 7-Day Average % Positivity
-0.59
Percentage point change in 7-Day Average % Positivity since Prior Week
*Test for SARS-CoV-2, the virus that causes COVID-19
COVID-19 NAAT Laboratory Test 7-day Percent Positivity by State/Territory