Aquatics FAQs
Recommendations for Fully Vaccinated People
COVID-19 Homepage

Testing…Testing…1,2,3
A robust and responsive laboratory testing system is essential to our success in stopping the spread of SARS-CoV-2, the virus that causes COVID-19. Testing is important to diagnose illness when someone has symptoms or has been exposed to COVID-19, and to track illness trends in communities. Expanded testing helps pandemic response efforts in the United States and informs individuals’ actions to stop further spread.
CDC’s updated guidance on SARS-CoV-2 testing offers a comprehensive approach that helps prevent the spread of COVID-19. The new guidance explains reasons for testing, the impact of vaccination on testing, available tests used to detect COVID-19 infection, how to choose which test to use, and health equity issues related to testing. These recommendations can help health department staff, healthcare providers, school officials, and the public make informed decisions about COVID-19 testing as a critical component of our national testing strategy.
Last week, the U.S. Department of Education announcedexternal icon it would provide all states, Puerto Rico, and the District of Columbia with $122 billion to support states to reopen K-12 schools safely and equitably expand opportunity for students who need it most. The U.S. Department of Health and Human Services also recently announcedexternal icon $10 billion to support expanded COVID-19 testing in schools nationwide. Testing to diagnose COVID-19 in schools, together with universal and correct use of masks, physical distancing, handwashing, and cleaning and maintaining healthy facilities, can help schools protect students and their families, teachers and staff, and the broader community by slowing the spread of COVID-19 while returning to in-person learning safely.
CDC is also investing $2.25 billion to address COVID-19 health disparities and advance health equity among people who are underserved or at higher risk of exposure, infection, hospitalization, and mortality, including racial and ethnic minority groups and people living in rural areas. To help track disparities, COVID-NET Hospitalization Surveillance Network data now allows COVID Data Tracker users to view COVID-19-associated hospitalizations by race/ethnicity over time. Ending this pandemic requires that everyone has equal access to affordable and timely testing, treatment, and vaccination.
Reported Cases
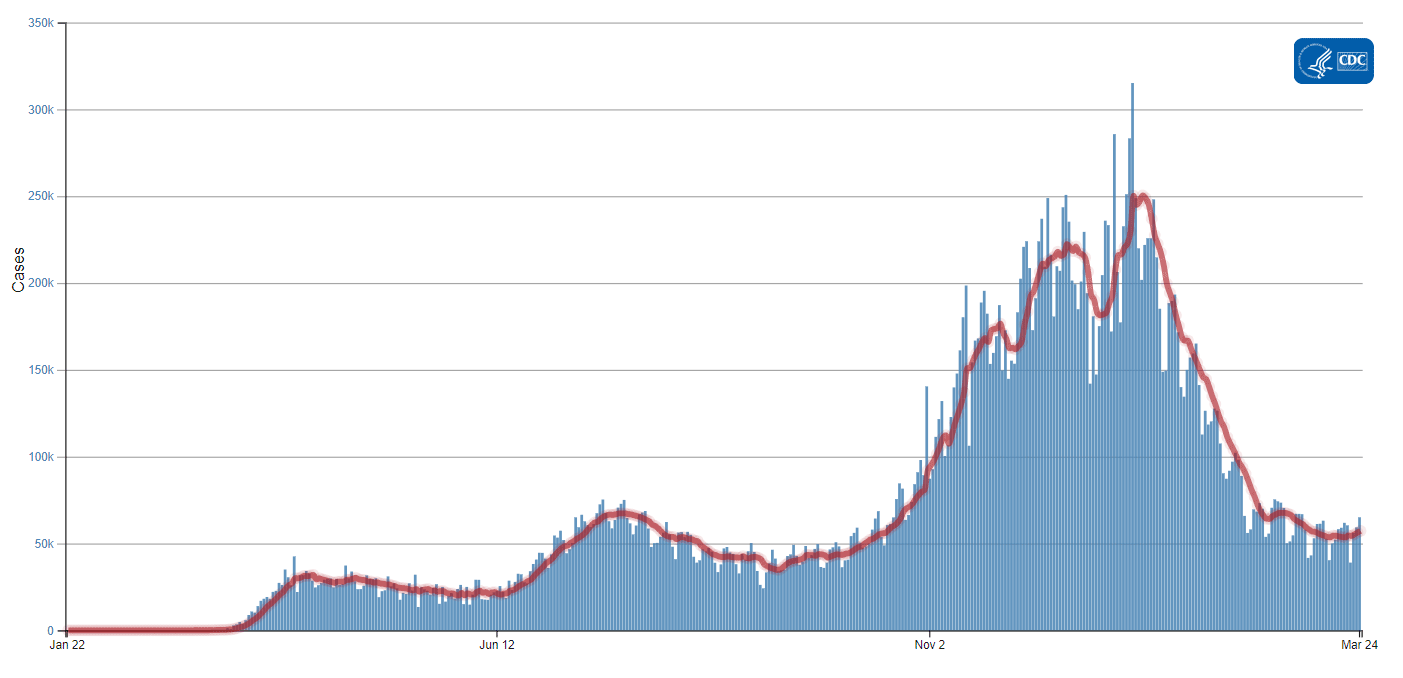
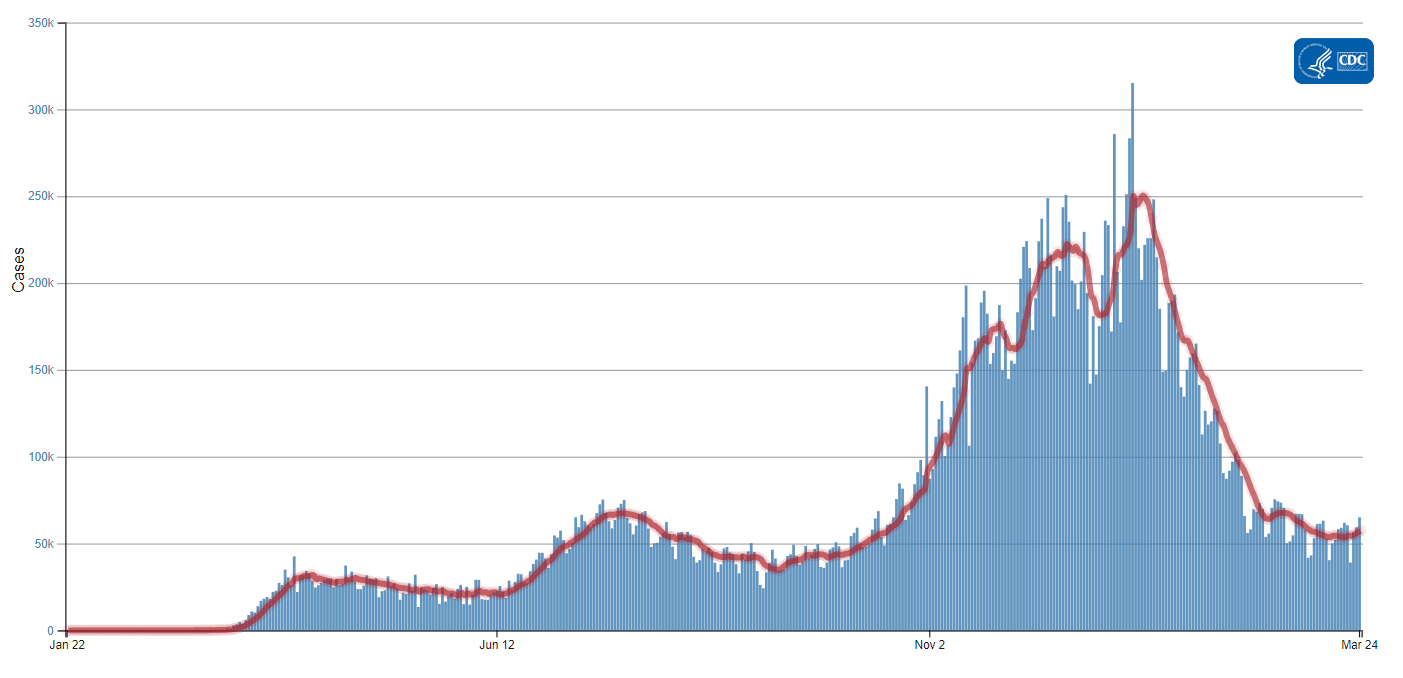
Overall, COVID-19 cases have decreased for the past 10 weeks, although we have seen consistent increases in the 7-day average of new cases over the past few days. The current 7-day moving average of new cases (56,995) decreased 77.2% compared with the highest peak on January 11, 2021 (250,400), and 15.4% compared with the second highest peak on July 23, 2020 (67,337). On March 24, there was a 6.7% increase in the 7-day average number of daily cases reported compared with the prior week.
64,397
New Cases Reported*
56,995
Current 7-Day Average**
29,834,734
Total Cases Reported
53,433
Prior 7-Day Average
250,400
Peak of 7-Day Average***
+6.7%
Change in 7-Day Average since Prior Week
*New cases and 7-day averages reported here may differ slightly from those on the COVID Data Tracker as we continue to incorporate jurisdictions’ updates to their historical data.
** In the current week, 1,775 historical cases were excluded, and in the prior week, 4,007 historical cases were excluded.
***Highest peak for 7-day average (January 11, 2021).
Note: The table above excludes historical data from the new cases, the current and previous 7-day averages, and the percent change in the 7-day average.
Daily Trends in COVID-19 Cases in the United States Reported to CDC

7-Day moving average
SARS-CoV-2 Variants
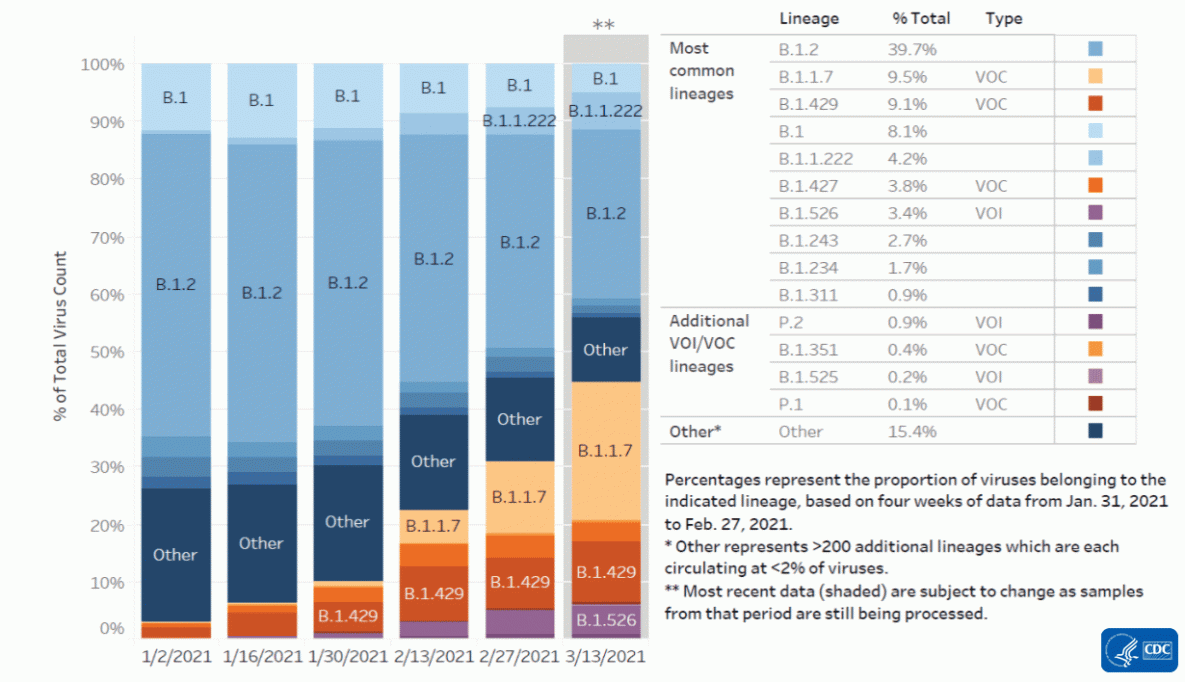
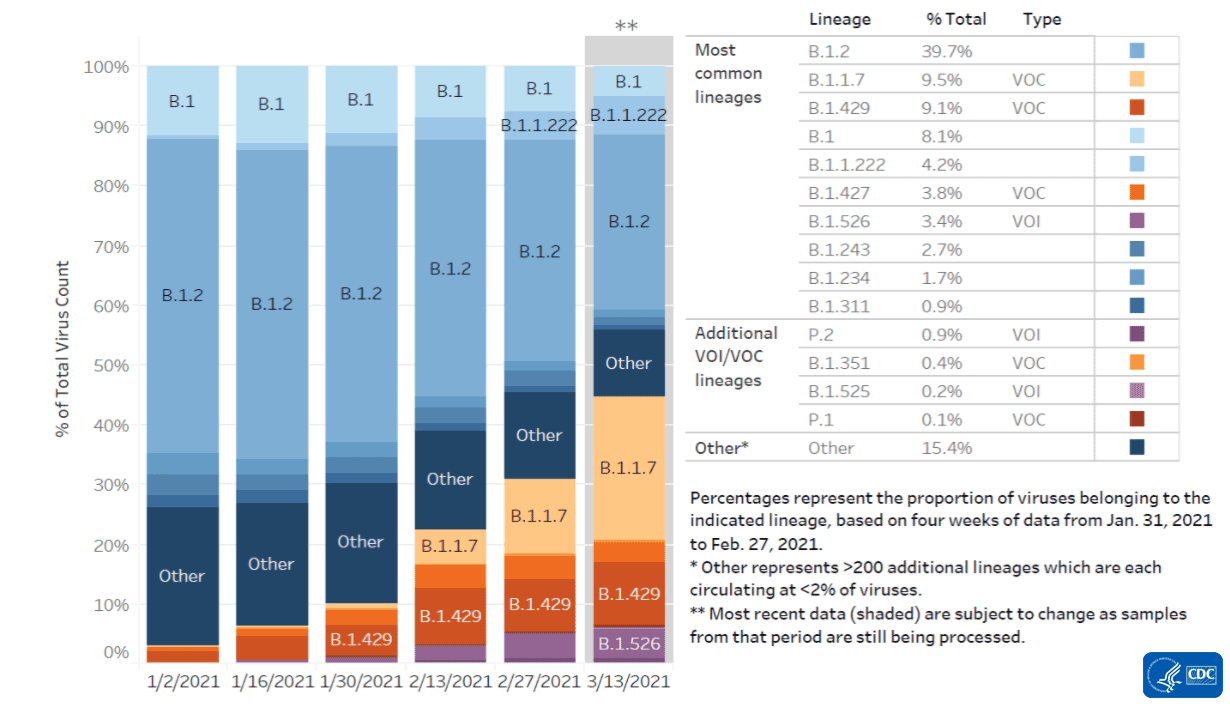
CDC recently published a Variant Proportions in the U.S., which describes how CDC characterizes the proportion of SARS-CoV-2 lineages circulating in the United States. This page also highlights the estimated proportion of SARS-CoV-2 variants of concern in select states for which CDC has at least 300 genome sequences available from specimens collected during the 4-week period ending February 27, 2021.
This is updated every Wednesday, and additional work is underway to produce model-based estimates of the prevalence of SARS-CoV-2 variants. These model-based estimates will be reported on the COVID Data Tracker soon.
As of March 25, a total of 8,337 B.1.1.7 variant cases have been reported in 51 jurisdictions. Also, 266 cases attributed to B.1.351 in 29 jurisdictions and 79 cases attributed to P.1 in 19 jurisdictions have been reported in the United States. In addition, the B.1.427 and B.1.429 variants that were first identified in the United States in January 2021 are also being closely monitored. CDC and partners are increasing the numbers of specimens sequenced in laboratories around the country. Studies are underway to determine whether variants are more transmissible, cause more severe illness, or are likely to evade immunity brought on by prior illness or vaccination.
Variant
Reported Cases in US
Number of Jurisdictions with ≥1 Case Reported
Variant
B.1.1.7
Reported Cases in US
8,337
Number of Jurisdictions with ≥1 Case Reported
51
Variant
B.1.351
Reported Cases in US
266
Number of Jurisdictions with ≥1 Case Reported
29
Variant
P.1
Reported Cases in US
79
Number of Jurisdictions with ≥1 Case Reported
19
Testing
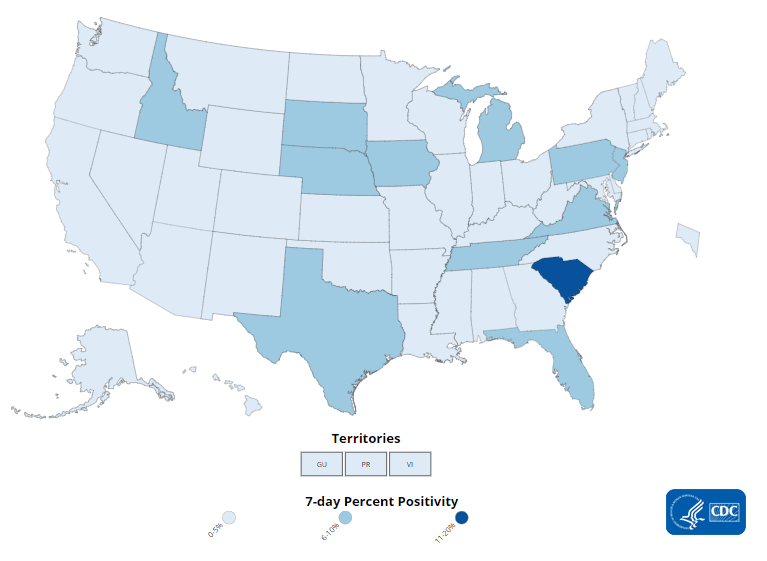
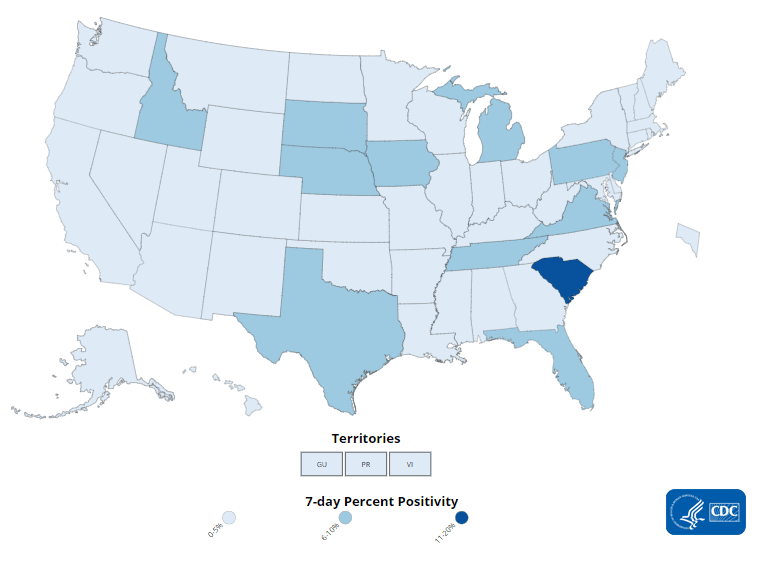
The percent of COVID-19 RT-PCR tests that are positive (percent positivity) has increased slightly from the previous week. The 7-day average of percent positivity from tests is now 4.7%. The 7-day average test volume for March 19-March 25, 2021, was 1,079,735, down 9.9% from 1,199,024 for the prior 7 days.
363,143,628
Total Tests Reported
1,079,735
7-Day Average Test Volume
363,143,628
Total Tests Reported
4.7%
7-Day Average
% Positivity
1,079,735
7-Day Average Test Volume
+9.4%
Change in 7-Day
% Positivity
COVID-19 Viral (RT-PCR) Laboratory Test 7-day Percent Positivity by State/Territory
Vaccinations
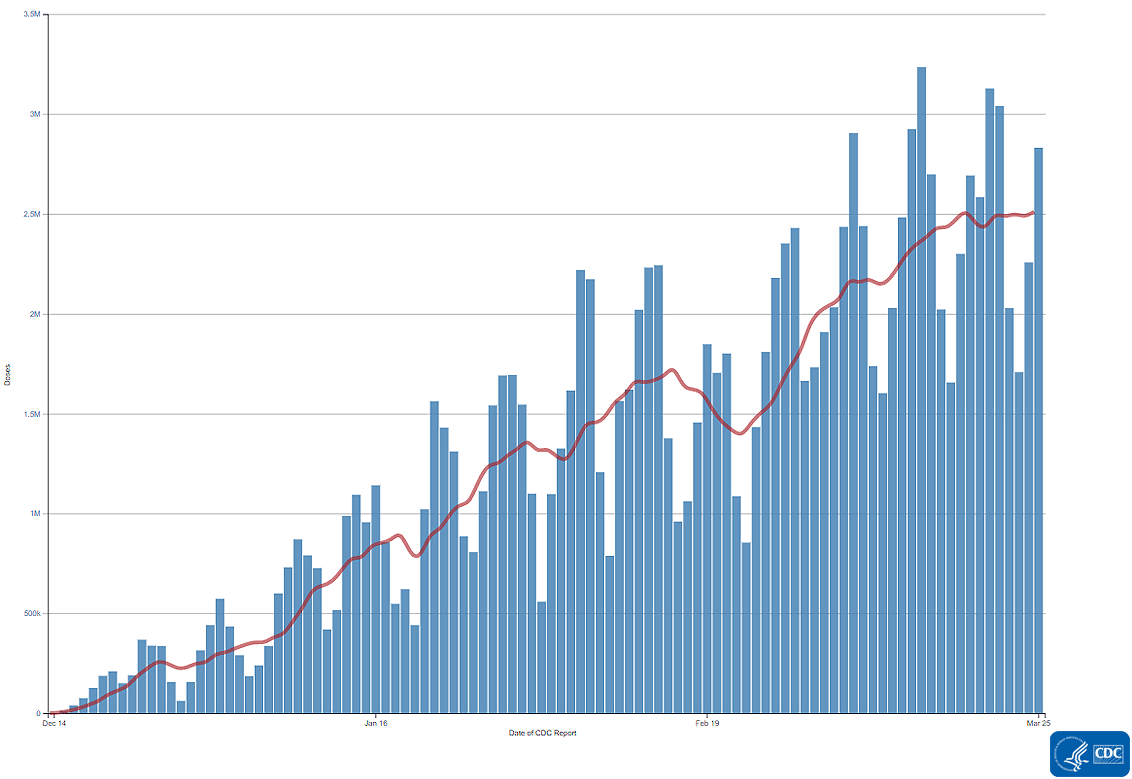
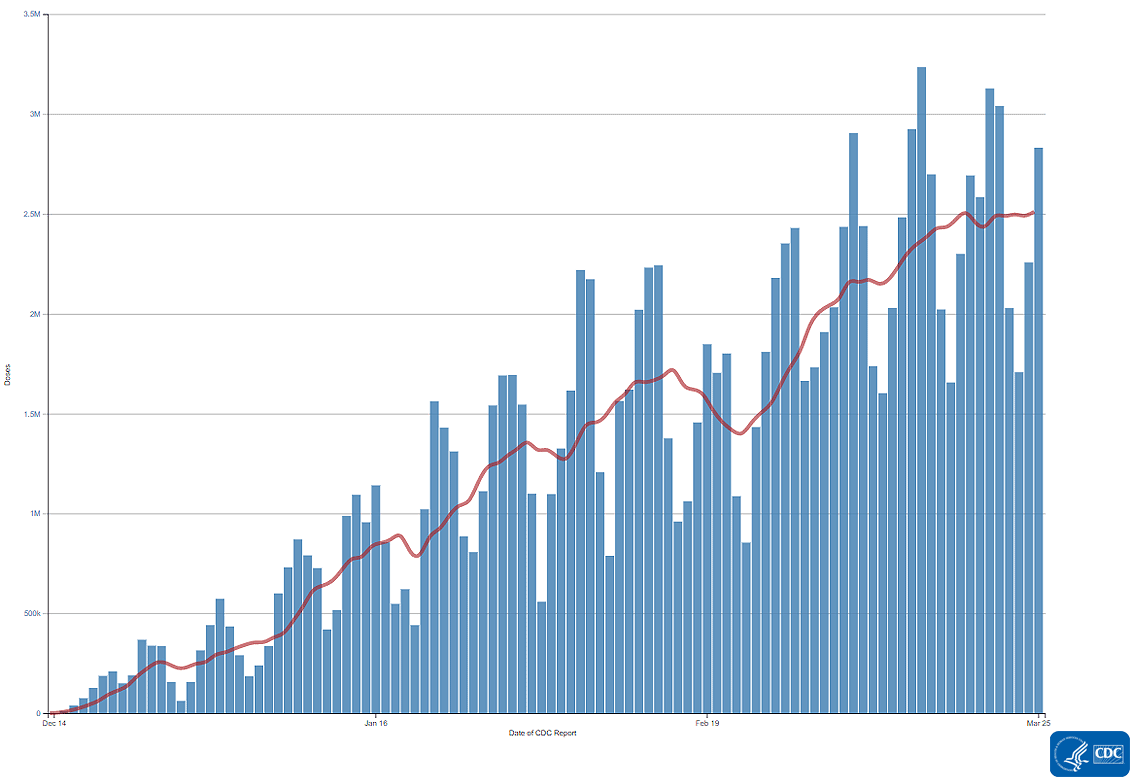
The U.S. COVID-19 Vaccination Program began December 14. As of March 24, 2021, 130.5 million vaccine doses have been administered. Overall, about 85.5 million people, or 25.7% of the U.S. population, have received at least one dose of vaccine. About 46.4 million people, or 14.0% of the U.S. population, have been fully vaccinated*. As of March 24, the 7-day average number of administered vaccine doses reported to CDC per day was 2.5 million, a 0.7% increase from the previous week.
Recent COVID Data Tracker updates show the percent of the population 65 years and older who have been vaccinated, and breakdowns of vaccine delivery, administration, and series completion by type. As of March 24, 70.3% of people 65 years or older have received at least one dose of vaccine; 43.8% are fully vaccinated.
130,473,853
Vaccines Administered
130,473,853
Vaccines Administered
85,472,166
People who received at least one dose
46,365,515
People who are fully vaccinated*
*People who are fully vaccinated (formerly “receiving 2 doses”) represents the number of people who have received the second dose in a two-dose COVID-19 vaccine series or one dose of the single-shot J&J/Janssen COVID-19 vaccine.
Daily Change in Number of COVID-19 Vaccinations in the United States Reported to CDC

7-Day moving average
New Hospital Admissions
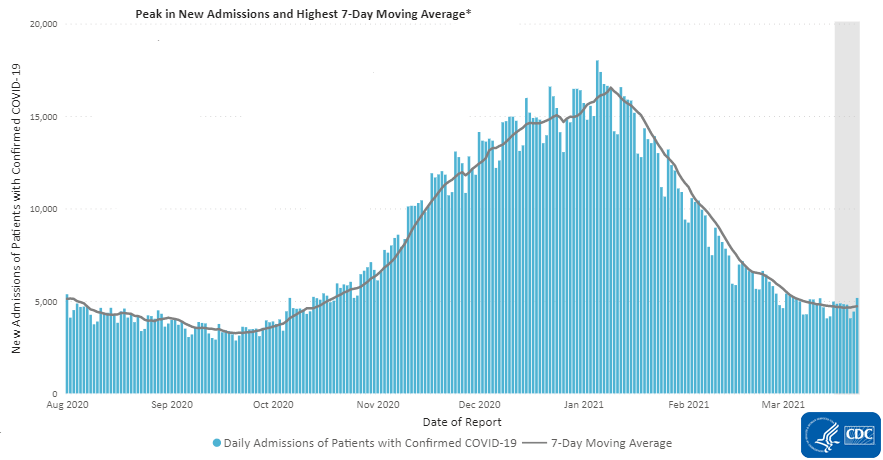
Hospital admissions of patients with confirmed COVID-19 decreased 71.5% from the national 7-day average peak of 16,540 admissions on January 9, 2021, to an average of 4,714 admissions over the 7-day period ending March 23, 2021. The average number of daily admissions increased by 0.1% compared to the previous week.
5,165
New Admissions
4,714
Current 7-Day Average
1,914,903
Total New Admissions
4,707
Prior 7-Day Average
16,540
Peak 7-Day Average
+0.1%
Change in 7-Day Average
Daily Trends in Number of New COVID-19 Hospital Admissions in the United States
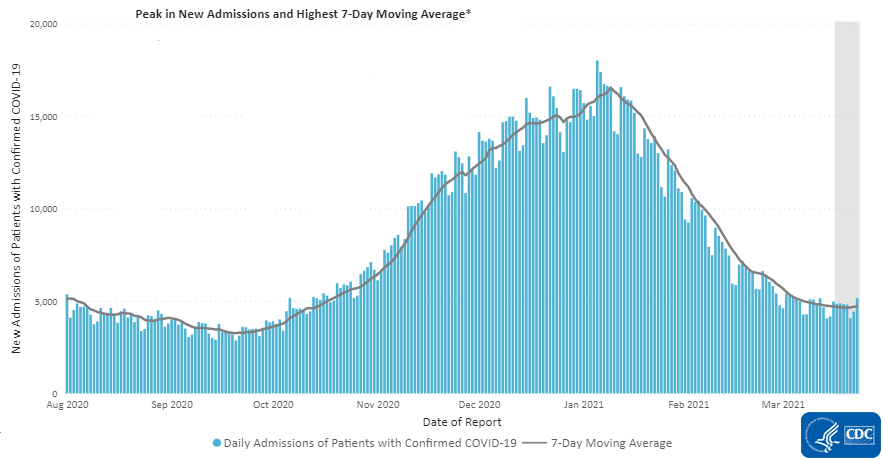
The most recent data in the vertical gray bar are provisional and should be interpreted with caution.
Trends in Hospitalizations among Racial and Ethnic Minority Groups
Long-standing inequalities have increased the risk for severe COVID-19 illnesses and death for many people in racial and ethnic minority groups. By improving race and ethnicity data collection and reporting, we continue to increase our understanding of health disparities related to COVID-19. This knowledge helps us create more equitable public health policies and prevention strategies.
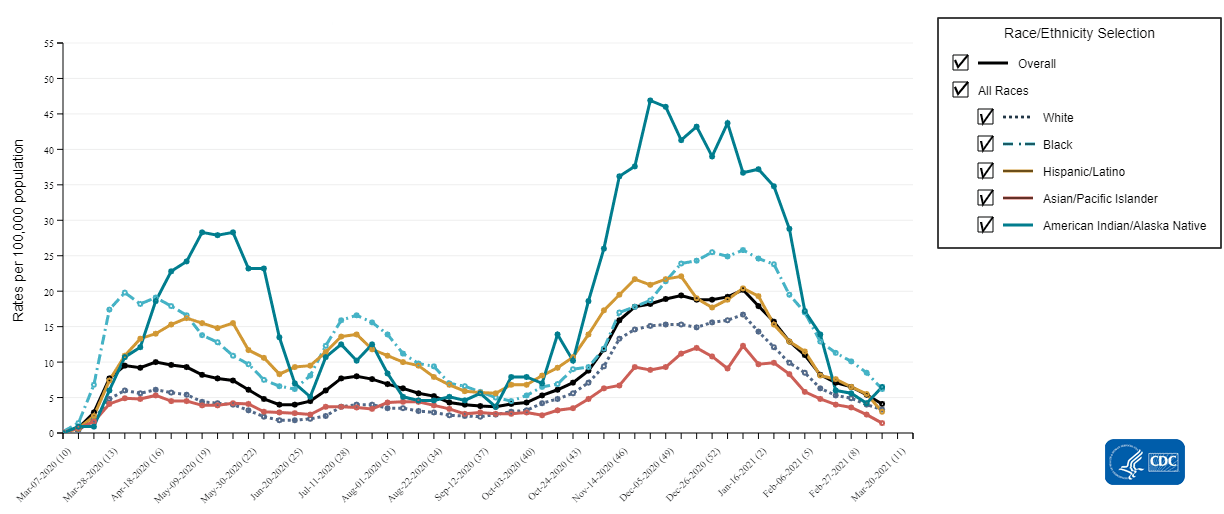
COVID-19-associated hospitalization rates have decreased in all races and ethnicities after peaking in early January. Rates for American Indian and Alaska Native persons have dropped by more than 50% from a peak of 46.9 per 100,000 in November to less than 15 per 100,000 in recent weeks. Similar declines of more than 50% have been seen for other race and ethnicity groups; as well, hospitalizations have decreased from their highest point in early January 2021.
Rates of COVID-19-Associated Hospitalization
The Coronavirus Disease 2019 (COVID-19)-Associated Hospitalization Surveillance Network (COVID-NET) is an additional source for hospitalization data collected through a network of more than 250 acute-care hospitals in 14 states (representing ~10% of the U.S. population). Detailed data on patient demographics, including race/ethnicity, underlying medical conditions, medical interventions, and clinical outcomes, are collected using a standardized case reporting form.
More COVID-NET DataDeaths
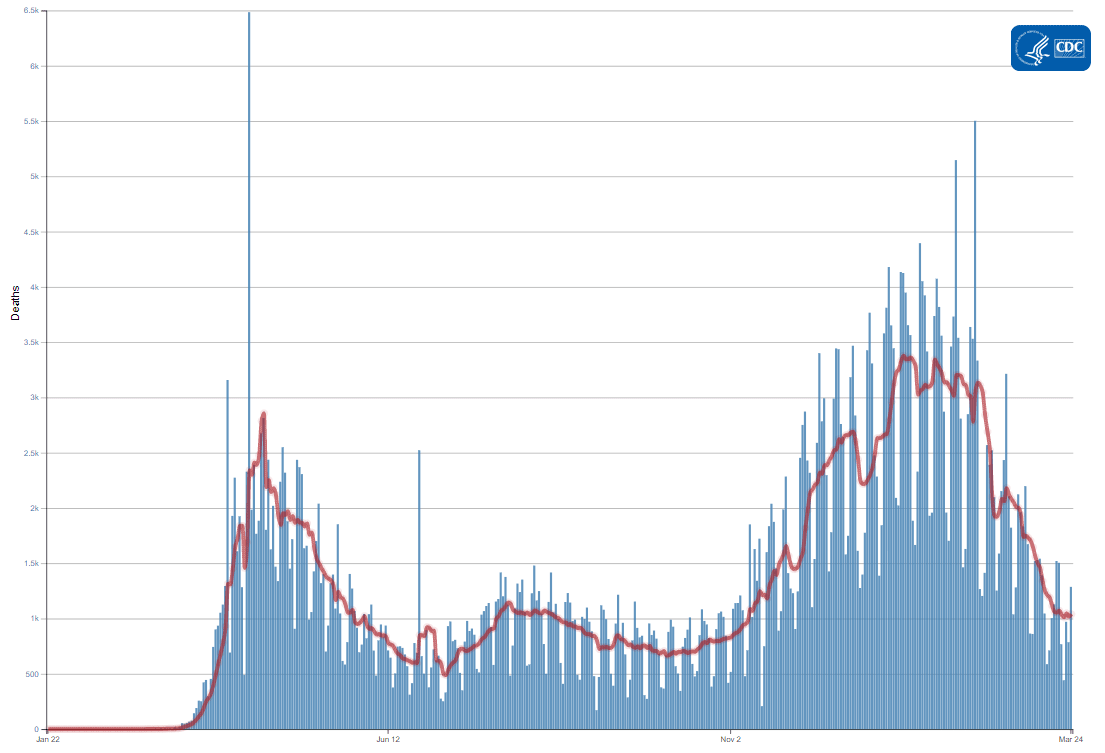
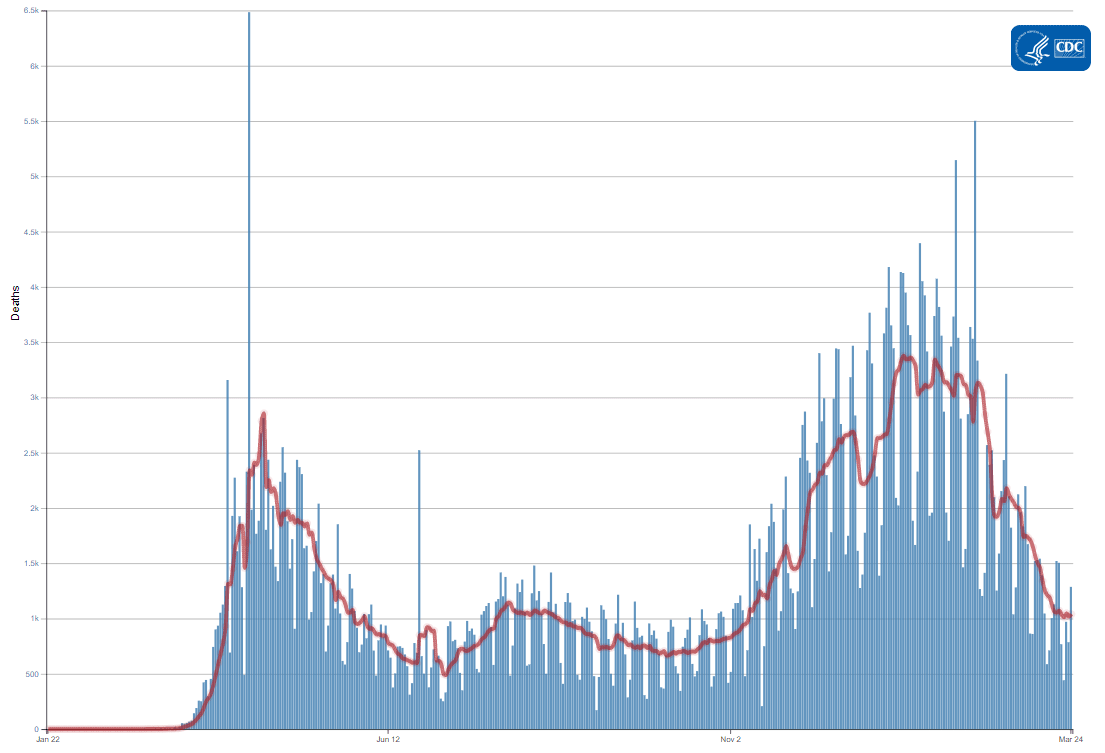
The number of COVID-19 deaths has continued to decline, a trend we observed over the past 10 weeks. The current 7-day moving average of new deaths (946) decreased 72.0% compared with the highest peak on January 13, 2021 (3,379), and 17.5% compared with the peak on August 1, 2020 (1,148). As of March 24, 2021, a total of 542,584 COVID-19 deaths were reported.
1,262
New Deaths Reported*
946
Current 7-Day Average**
542,584
Total Deaths Reported
1,031
Prior 7-Day Average
3,379
Peak of 7-day Average***
-8.2%
Change in the 7-Day Average Since the Prior Week
*New cases and 7-day averages reported here may differ slightly from those on the COVID Data Tracker as we continue to incorporate jurisdictions’ updates to their historical data.
** In the current week, there were 655 historical deaths excluded, and in the prior week, there were 195 historical deaths excluded.
*** The highest peak in the 7-day average of new deaths (Jan 13, 2021).
Note: The table above excludes historical data from the new deaths, the current and previous 7-day averages, and the percent change in the 7-day average.
Daily Trends in Number of COVID-19 Deaths in the United States Reported to CDC

7-Day moving average
More Death Data- Counties with High COVID-19 Incidence and Relatively Large Racial and Ethnic Minority Populations — United States, April 1–December 22, 2020
- County-Level COVID-19 Vaccination Coverage and Social Vulnerability — United States, December 14, 2020–March 1, 2021
- COVID-19 in Primary and Secondary School Settings During the First Semester of School Reopening — Florida, August–December 2020
- Pilot Investigation of SARS-CoV-2 Secondary Transmission in Kindergarten Through Grade 12 Schools Implementing Mitigation Strategies — St. Louis County and City of Springfield, Missouri, December 2020
Recent COVID Data Tracker Updates
- The enhanced Community Characteristics table on the County View tab classifies counties according to their urban/rural status and provides county, state and US estimates for each characteristic for comparison.
- New COVID-NET Hospitalization Surveillance Network tab in the Health Care Settings Data section allows users to view COVID-19-associated hospitalizations by age, sex, race/ethnicity, underlying medical conditions, and more, over time.
- New About Health Care Setting Data page describes the various health care setting data streams displayed.
- New dashboards on COVID Data Tracker display changes in the impact of the pandemic over time. This feature includes interactive visualizations that allow users to see changes in the impact of the pandemic over time by race and ethnicity.
- The COVID-19 Vaccinations in the US and the COVID-19 Vaccinations in Long-Term Care Facilities pages now include the Johnson & Johnson Janssen vaccine. Additional updates to the COVID-19 Vaccinations in the US page show the percent of the population 65 years and older who have been vaccinated, and the breakdown of vaccine delivery, administration, and series completion by vaccination manufacturer type.
