Aquatics FAQs
Recommendations for Fully Vaccinated People
COVID-19 Homepage
Have You Heard? We’re at One-Third!
Have You Heard? We’re at One-Third!

As of April 22, 2021, one in three people in the United States over the age of 18 years are fully vaccinated and more than half of U.S. adults have received at least one dose of a COVID-19 vaccine. Widespread vaccination is a critical tool to help stop the pandemic. A recent CDC study shows that, once fully vaccinated, a person’s risk of infection is reduced by up to 90%.* The efficacy seen in clinical trials is now being shown in the real world. Current data also suggest that COVID-19 vaccines offer protection against the variants circulating in the United States.
Some people who are fully vaccinated against COVID-19 may still get sick because no vaccine is 100% effective. Last week, CDC released data on the number of “breakthrough” infections of people who, despite being vaccinated, still tested positive for COVID-19 more than 14 days after getting their second dose of a COVID-19 vaccine. However, as of last week, there were fewer than 6,000 “breakthrough” infections reported, which represents less than 1% of people who have been fully vaccinated. Of these, approximately 30% had no symptoms at all. Two recent CDC reports1,2 show that COVID-19 vaccines help protect people who are vaccinated from getting COVID-19 and may reduce severity of illness among people who get vaccinated but still get COVID-19.
Getting a vaccine will help protect you, help protect others, and help end the pandemic. More vaccinations equals fewer infections and fewer variants. Previously, certain groups were prioritized for COVID-19 vaccination. Now, all people in the United States age 16 and older are eligible for a COVID-19 vaccine. Vaccines are free and increasingly available. To find a vaccination provider near you, visit Vaccine Finderexternal icon or your state or local public health department website.
* A recent CDC study provides strong evidence that mRNA COVID-19 vaccines, which include the Pfizer-BioNTech and Moderna vaccines, are highly effective in preventing SARS-CoV-2 infections in real-world conditions. The study found that “partial” vaccination (two weeks after a single dose) with either a Pfizer-BioNTech or Moderna vaccine reduced the risk of infection by 80%. “Full” vaccination (two weeks after the second dose) reduced risk of infection by 90%. Last week the FDAexternal icon and CDC recommended a pause in the use of the Johnson & Johnson/Janssen (J&J) vaccine to review data involving six reported U.S. cases of a rare and severe type of blood clot in individuals after receiving the J&J vaccine. These cases are rare and were identified through CDC’s vaccine safety monitoring system. The events of last week serve as a reminder that safety is a top priority.
Reported Cases
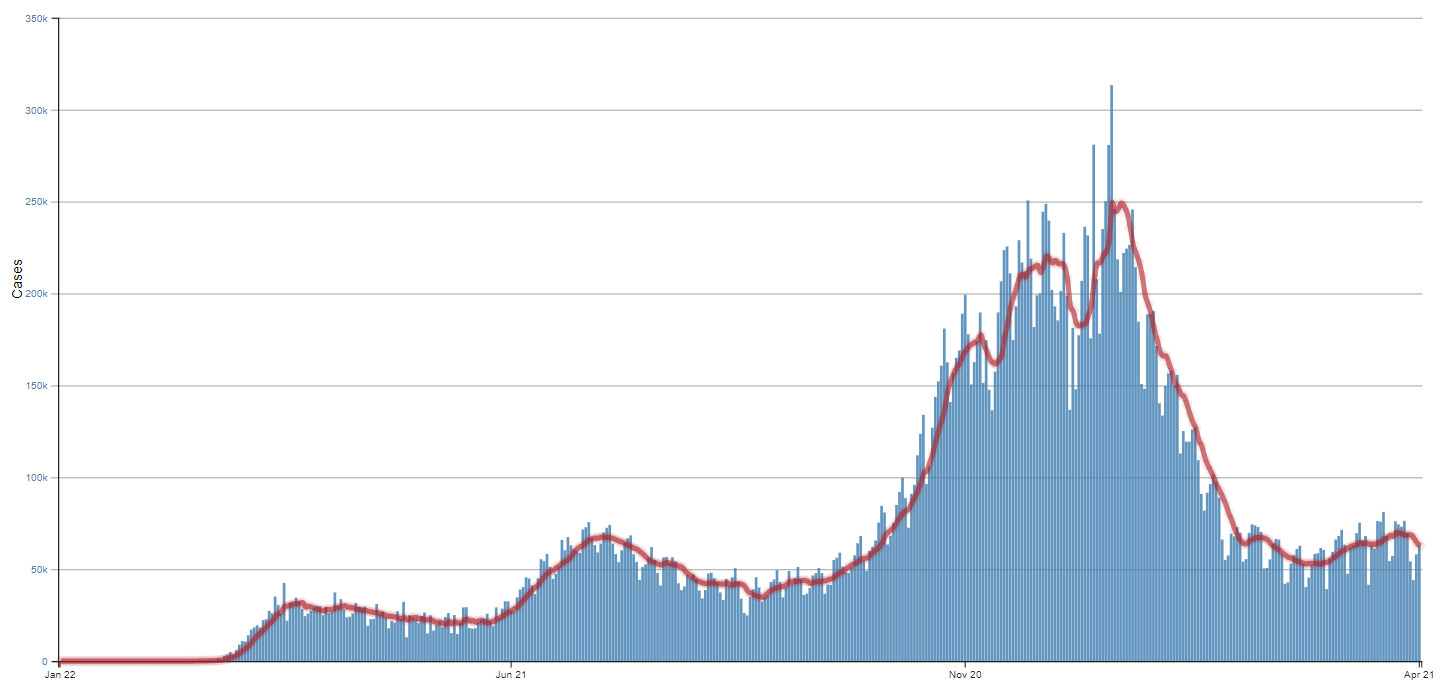
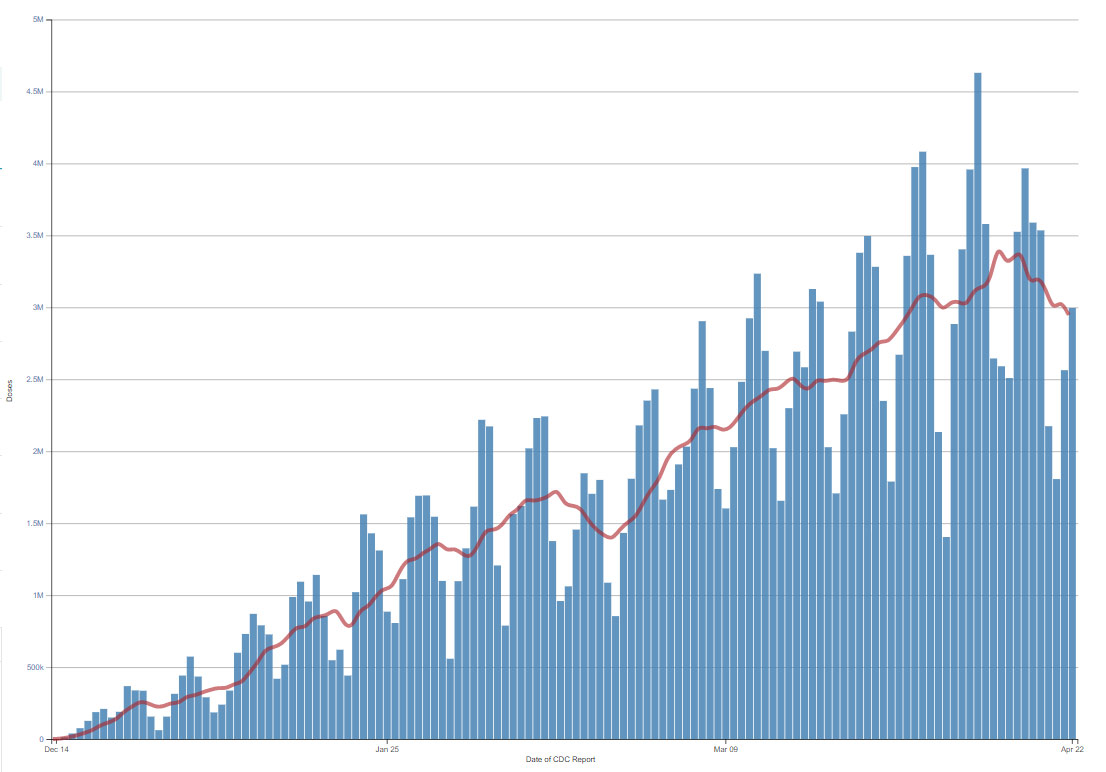
The current 7-day moving average of daily new cases (62,596) decreased 10.1% compared with the previous 7-day moving average (69,614). Compared with the highest peak on January 8, 2021 (249,436), the current 7-day average decreased 74.9%. A total of 31,666,546 COVID-19 cases were reported as of April 21, 2021, including 62,827 new cases.
62,827
New Cases Reported
62,596
Current 7-Day Average*
31,666,546
Total Cases Reported
69,614
Prior 7-Day Average
249,436
Peak of 7-Day Average**
-10.1%
Change in 7-Day Average since Prior Week
*Historical cases are excluded from 7-day average calculations. Of 89,900 historical cases reported retroactively (with missing report dates), 5,434 were reported in the current week, and 6,301 were reported in the prior week.
**Highest peak for 7-day average (January 8, 2021).
Note: The table above excludes historical data with missing report dates from the new cases, the current and previous 7-day averages, and the percent change in the 7-day average.
Daily Trends in COVID-19 Cases in the United States Reported to CDC

7-Day moving average

SARS-CoV-2 Variants
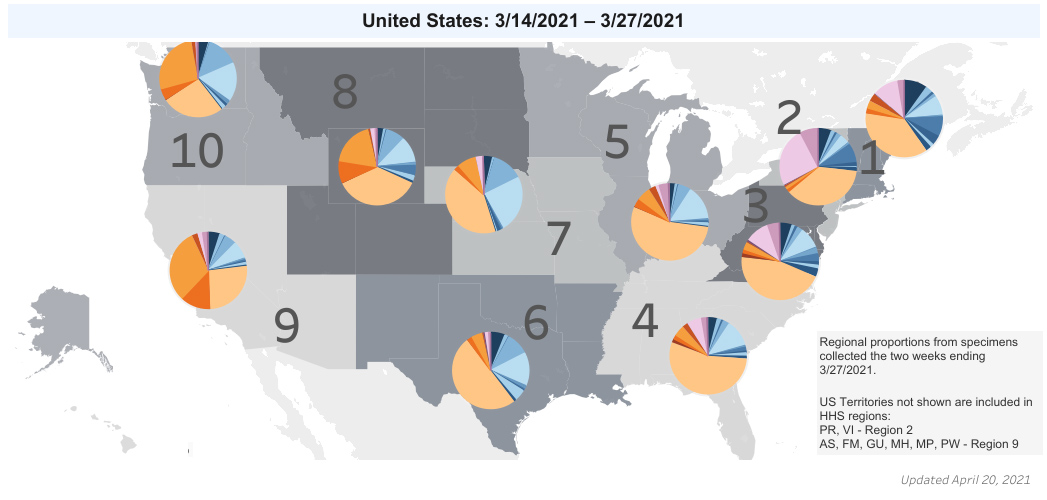
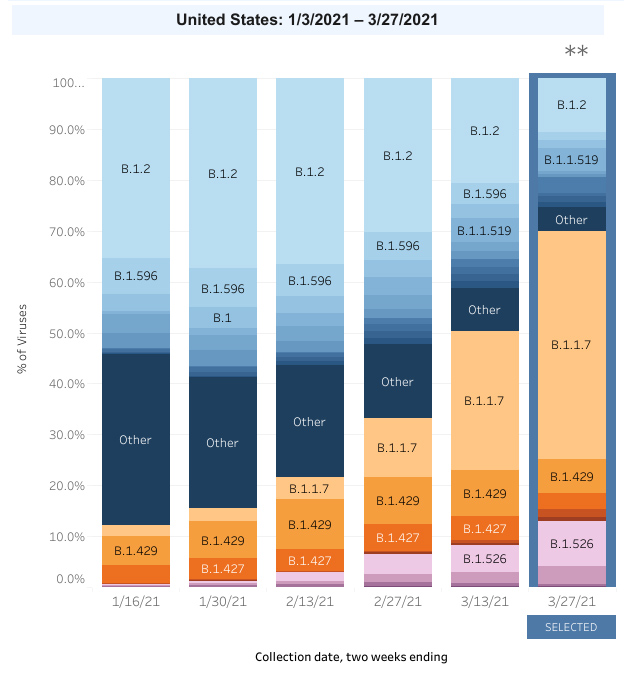
Multiple variants of the virus that causes COVID-19 are circulating globally and within the United States. Based on specimens collected from March 14 to March 27, an estimated 44.7% of COVID-19 cases in the United States are caused by the SARS-CoV-2 variant B.1.1.7. The proportion of cases caused by B.1.429 is estimated at 6.9%, and the proportion of cases caused by B.1.427 is estimated at 3.1%. Variant P.1 is estimated to comprise 1.5% of COVID-19 cases, and the proportion of B.1.351 cases is estimated to be 0.7% for the end of March. Proportion estimates provided in COVID Data Tracker can now be viewed at the national or regional level in 2-week intervals.
CDC and partners are increasing the numbers of specimens sequenced in laboratories around the country. For the week ending April 17, over 31,000 sequences were published in public repositories through CDC sequencing efforts. Studies are underway to determine whether variants are more transmissible, cause more severe illness, or are likely to evade immunity brought on by prior illness or vaccination.
Note: To paint a clearer picture of how prevalent specific variants are in the United States, CDC analyzes available genomic sequence data from specimens of SARS-CoV-2 collected from patients. These data are weighted to account for known differences in diagnostic testing and sequencing across time and geography.


Testing
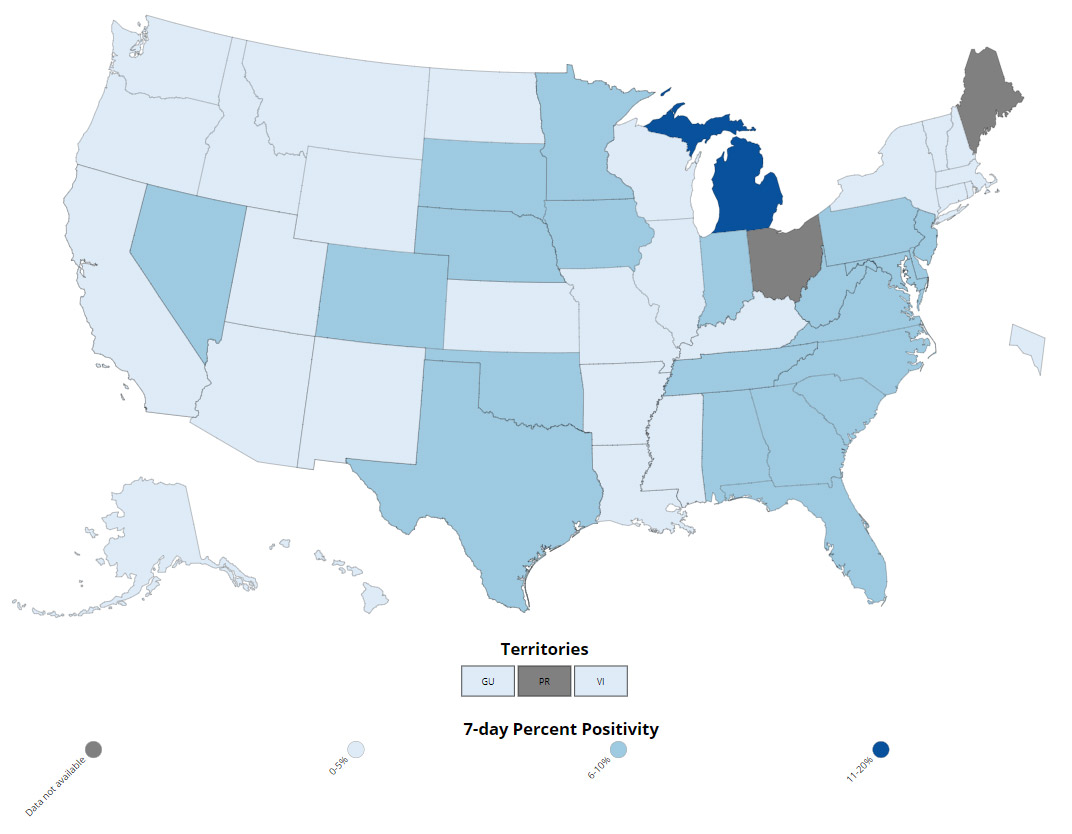
The percentage of COVID-19 RT-PCR tests that are positive (percent positivity) has decreased from the previous week. The 7-day average of percent positivity from tests is now 5.2%. The 7-day average test volume for April 9-April 15, 2021, was 1,189,820, up 1.6% from 1,170,968 for the prior 7 days.
404,035,737
Total Tests Reported
1,189,820
7-Day Average Test Volume
404,035,737
Total Tests Reported
5.2%
7-Day Average
% Positivity
1,189,820
7-Day Average Test Volume
-5.4%
Change in 7-Day
% Positivity
COVID-19 Viral (RT-PCR) Laboratory Test 7-day Percent Positivity by State/Territory
 Laboratory Test 7-day Percent Positivity by State/Territory")
Vaccinations
The U.S. COVID-19 Vaccination Program began December 14, 2020. As of April 22, 2021, 218.9 million vaccine doses have been administered. Overall, about 135.8 million people, or 40.9% of the total U.S. population, have received at least one dose of vaccine. About 89.2 million people, or 26.9% of the total U.S. population, have been fully vaccinated.* As of April 22, the 7-day average number of administered vaccine doses reported to CDC per day was 2.9 million, a 12% decrease from the previous week.
The COVID Data Tracker Vaccination Demographic Trends tab shows vaccination trends by age group. As of April 22, 80.7% of people ages 65 or older have received at least one dose of vaccine and 66% are fully vaccinated. Just over one-half (52%) of people ages 18 or older have received at least one dose of vaccine and 34.4% are fully vaccinated.
218,947,643
Vaccines Administered
135,791,031
People who received at least one dose
89,245,776
People who are fully vaccinated*
40.9%
Percentage of the US population that has received at least one dose
26.9%
Percentage of the US population that has been fully vaccinated*
+3.0
percentage point increase from last week
+3.3
percentage point increase from last week
*People who are fully vaccinated (formerly “receiving 2 doses”) represents the number of people who have received the second dose in a two-dose COVID-19 vaccine series or one dose of the single-shot J&J/Janssen COVID-19 vaccine.
Daily Change in Number of COVID-19 Vaccinations in the United States Reported to CDC
7-Day moving average

Hospitalizations
New Hospital Admissions
New admissions have decreased considerably since their January peaks. However, since March 22, 2021, the 7-day moving average has been generally increasing. The current 7-day average for April 14–April 20, 2021, was 5,631. This is a 1.6% increase from the prior 7-day average (5,541) from April 7–April 13, 2021.
5,963
New Admissions
5,631
Current 7-Day Average
2,062,916
Total New Admissions
5,541
Prior 7-Day Average
16,521
Peak 7-Day Average*
+1.6%
Change in 7-Day Average
*Highest peak for 7-day average (January 9, 2021).
COVID-NET: Trends in Clinical Outcomes
CDC’s Coronavirus Disease 2019-Associated Hospitalization Surveillance Network (COVID-NET) now has monthly data describing severe COVID-19 over the first year of the pandemic, including data related to demographics, underlying medical and clinical outcomes, including intensive care unit admission. Among hospitalized cases, the percentage of intensive care unit (ICU) admissions declined during the first 7 months of the pandemic, then leveled off or increased in November through January. The percentage of hospitalized cases admitted to the ICU decreased in February 2021, when 15.9%, or about 1 in 6 hospitalized COVID-19 patients, were admitted to the ICU. Positive trends over the pandemic, especially during the first 7 months, may in part have been due to evolving healthcare provider and system practices, guided by increasing knowledge and experience in treating patients with COVID-19.
Daily Trends in Number of New COVID-19 Hospital Admissions in the United States

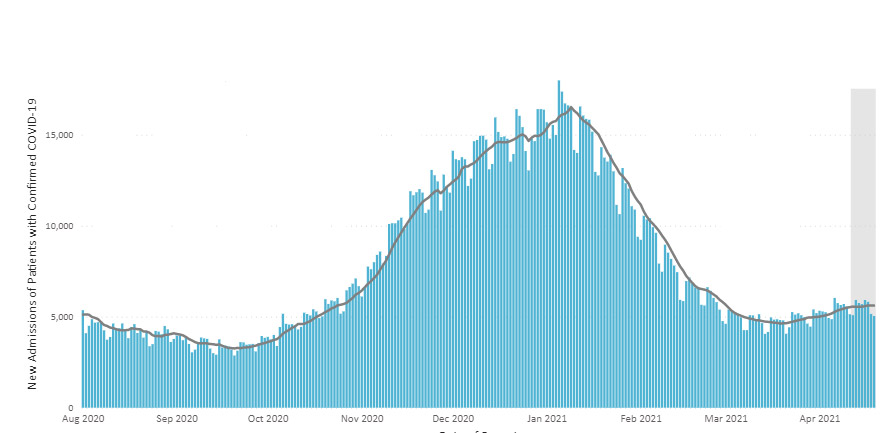
New admissions are pulled from a 10 am EST snapshot of the HHS Unified Hospital Timeseries Dataset. Due to potential reporting delays, data from the most recent 7 days, as noted in the figure above with the grey bar, should be interpreted with caution. Small shifts in historic data may also occur due to changes in the CMS Provider of Services file, which is used to identify the cohort of included hospitals.
Trends in Intensive Care Unit Admission in COVID-19 Associated Hospitalizations

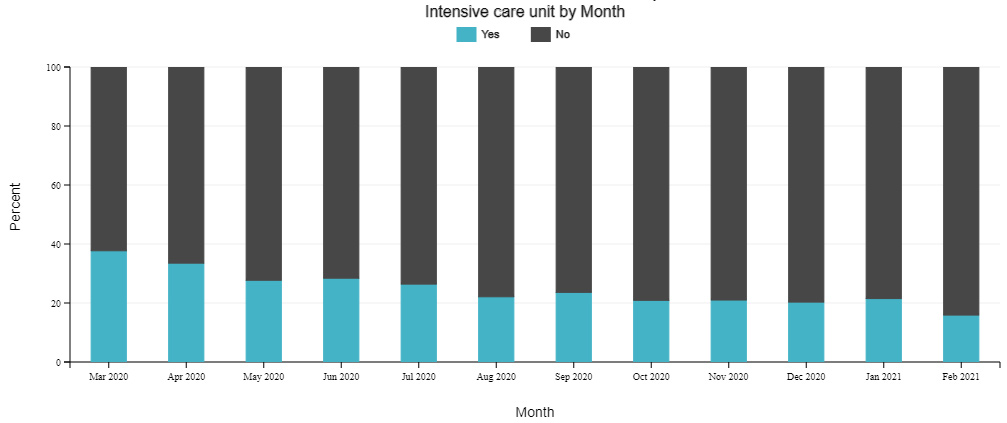
The Coronavirus Disease 2019 (COVID-19)-Associated Hospitalization Surveillance Network (COVID-NET) is an additional source for hospitalization data collected through a network of more than 250 acute-care hospitals in 14 states (representing ~10% of the U.S. population). Detailed data on patient demographics, including race/ethnicity, underlying medical conditions, medical interventions, and clinical outcomes, are collected using a standardized case reporting form.
More COVID-NET DataDeaths
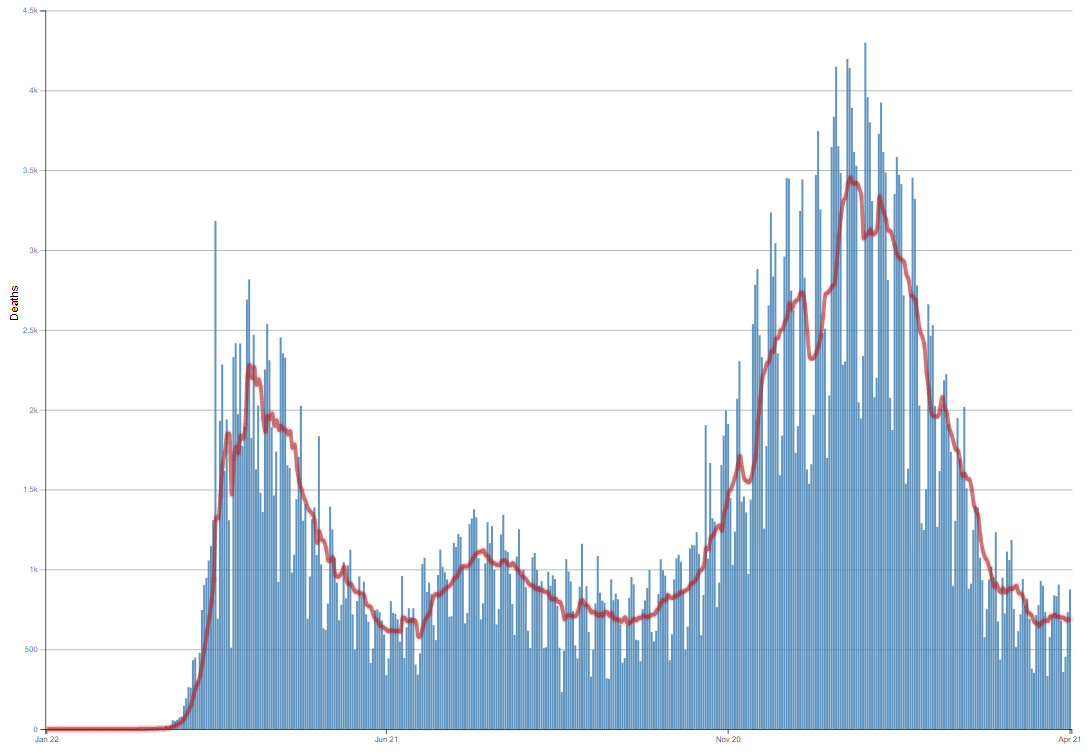
The 7-day average of daily new deaths (691) decreased 3.7% compared with the prior 7-day average. As of April 21, 2021, a total of 566,494 COVID-19 deaths have been reported, including 875 new deaths.
875
New Deaths Reported
691
Current 7-Day Average*
566,494
Total Deaths Reported
717
Prior 7-Day Average
3,457
Peak of 7-day Average**
-3.7%
Change in the 7-Day Average Since the Prior Week
*Of 13,837 historical deaths reported retroactively (with missing report dates), 257 were reported in the current week, and 194 were reported in the prior week.
**The highest peak in the 7-day average of new deaths (Jan 13, 2021).
Note: The table above excludes historical data with missing report dates from the new deaths, the current and previous 7-day averages, and the percent change in the 7-day average.
Daily Trends in Number of COVID-19 Deaths in the United States Reported to CDC
7-Day moving average
More Death Data
Recent COVID Data Tracker Updates
- New Global Vaccinations tab that displays vaccination counts and rates by country
- New visualization on Pregnant Women tab that displays cases among pregnant people by week
- Addition of testing metrics on the US and State Trends tab
- Updated Variant Proportions tab that shows variant proportions by region