Aquatics FAQs
Recommendations for Fully Vaccinated People
COVID-19 Homepage
Going Once? Going Twice? Vaccinated!
Interpretive Summary for May 7, 2021
Going Once? Going Twice? Vaccinated!

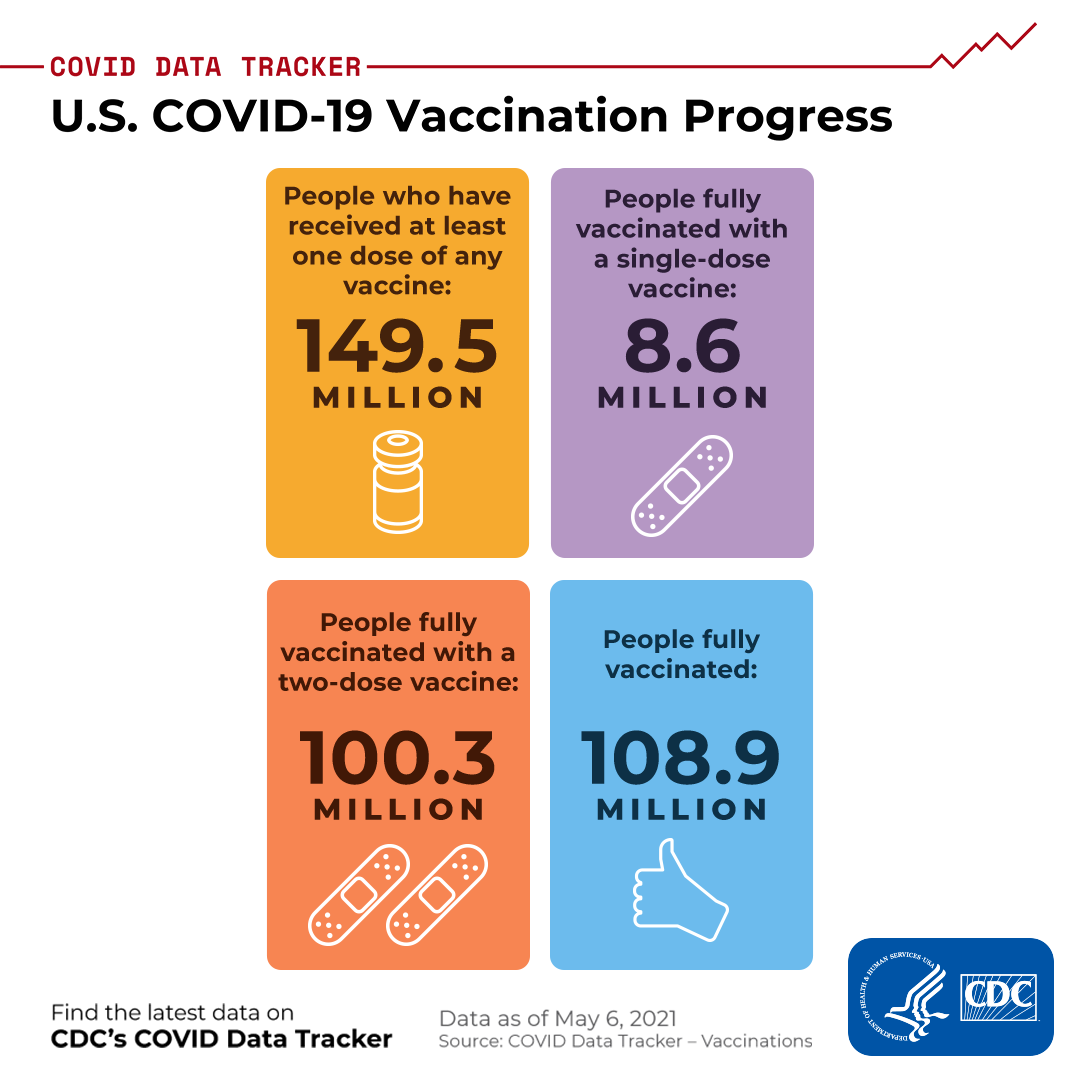
Following a rapid acceleration in vaccination rates, we are now seeing U.S. vaccination progress slow. This is not surprising considering the prior focus on vaccinating people at increased risk. Also, people eager to be immunized when they became eligible may have already secured their vaccine in line with increased supply. While more than 8 in 10 people 65 years and older have received at least one dose of vaccine, only around 1 in 3 people ages 18-29 have. All age groups currently eligible for the vaccine can benefit from the protection it provides themselves and others, especially as more states are easing prevention measures.
Three COVID-19 vaccines are currently authorized and recommended for use in the United States, including the one-dose Johnson & Johnson/Janssen vaccine and the two-dose Pfizer BioNTech and Moderna vaccines. All three vaccines are safe, effective, and reduce your risk of severe illness. To receive the most protection, you should receive all recommended doses of a COVID-19 vaccine. It typically takes about two weeks after your last dose for the body to build full protection, which means you should still practice the same prevention measures you did before vaccination. Once you are fully vaccinated, you can start doing many things you had stopped doing because of the pandemic.
Everyone who gets vaccinated does so for a reason—to protect themselves and their family, or to safely get back to activities like seeing friends, resuming work, or returning to school. Still, some people are hesitant to get their COVID-19 vaccine. COVID-19 vaccines are new, and it’s normal for people to have questions about them. If you or someone you know is hesitant about COVID-19 vaccination, CDC has information to help with the decision. To find a vaccine provider near you, visit Vaccines.gov or your state or local public health department website.
Reported Cases
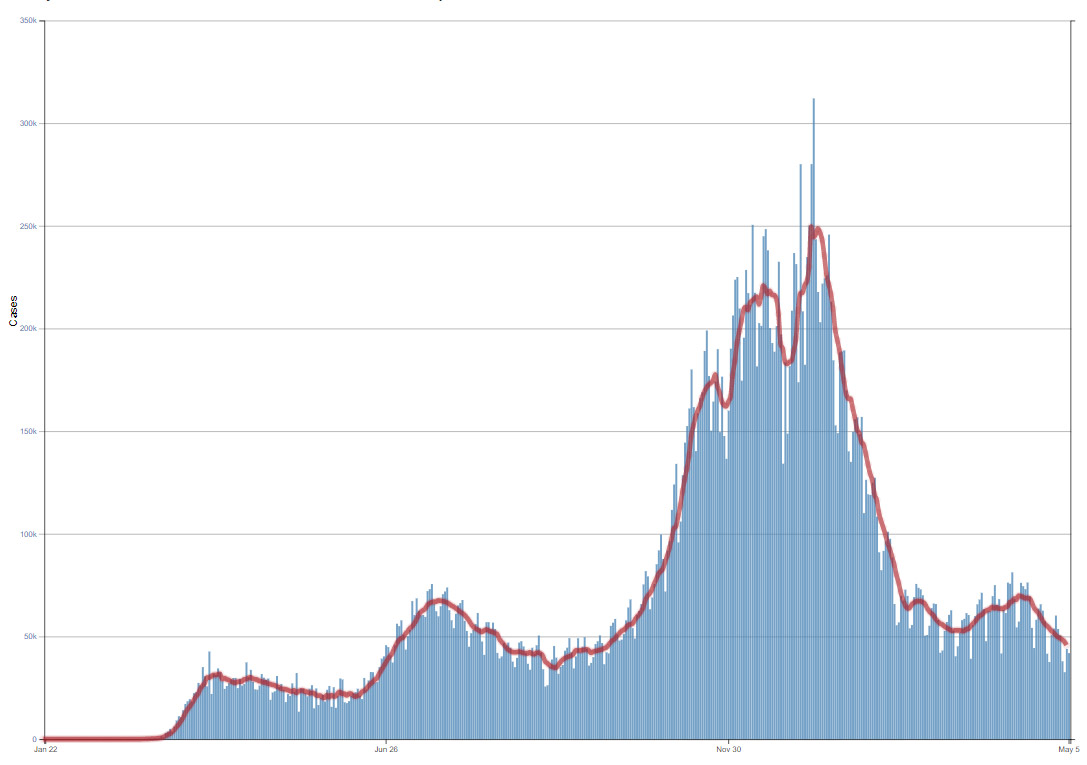
The current 7-day moving average of daily new cases (45,817) decreased 13.2% compared with the previous 7-day moving average (52,772). Compared with the highest peak on January 8, 2021 (249,672), the current 7-day average decreased 81.6%. A total of 32,356,034 COVID-19 cases have been reported as of May 5.
32,356,034
Total Cases Reported
45,817
Current 7-Day Average*
52,772
Prior 7-Day Average
-13.2%
Change in 7-Day Average since Prior Week
*Historical cases are excluded from daily new cases and 7-day average calculations until they are incorporated into the dataset for the applicable date. Of 86,630 historical cases reported retroactively, 1,649 were reported in the current week and 3,462 were reported in the prior week.
Note: In the above table, historical data with missing report dates are excluded from current and prior 7-day averages, and the percent change in the 7-day average.
Daily Trends in COVID-19 Cases in the United States Reported to CDC

7-Day moving average

SARS-CoV-2 Variants
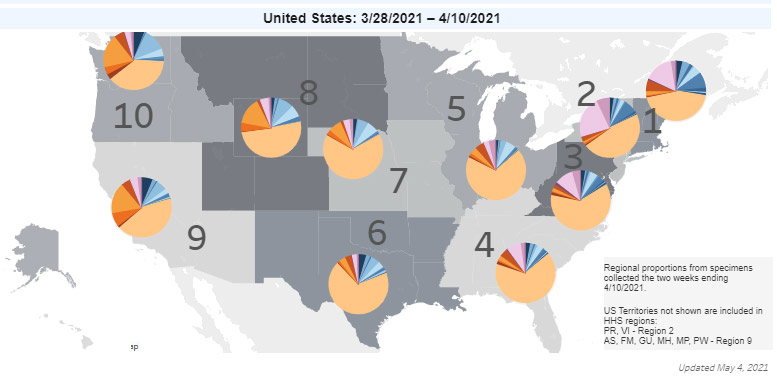
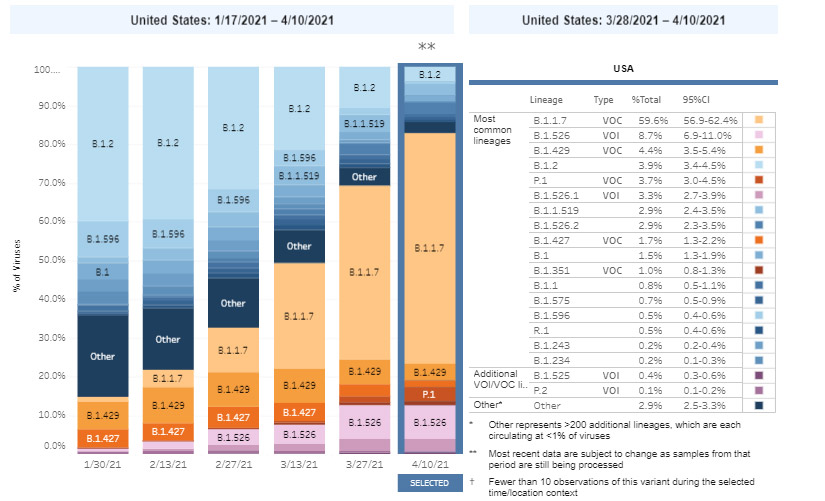
Multiple variants of the virus that causes COVID-19 are circulating globally and within the United States. To date, five variants have been classified as a variant of concern, and the weighted estimates of proportions of SARS-CoV-2 cases caused by these variants are summarized below.
Based on specimens collected from March 28 to April 10, an estimated 59.6% of COVID-19 cases in the United States are caused by the SARS-CoV-2 variant B.1.1.7. Twenty-five states now have B.1.1.7 proportions greater than 30%. The proportion of cases caused by B.1.429 is estimated at 4.4%, and the proportion of cases caused by B.1.427 is estimated at 1.7%. California continues to have the highest proportion of B.1.427/429 at 38.4%. Variant P.1 is estimated to comprise 3.7% of COVID-19 cases, and the proportion of B.1.351 cases is estimated to be 1.0% for the two weeks ending April 10. Proportion estimates provided in COVID Data Tracker can now be viewed at the national or regional level in 2-week intervals.
Note: To paint a clearer picture of how prevalent specific variants are in the United States, CDC analyzes available genomic sequence data from specimens of SARS-CoV-2 collected from patients. These data are weighted to account for known differences in diagnostic testing and sequencing across time and geography. Nowcasting (modeling) estimates are now available on the Variant Proportions tab of the COVID Data Tracker.


Testing
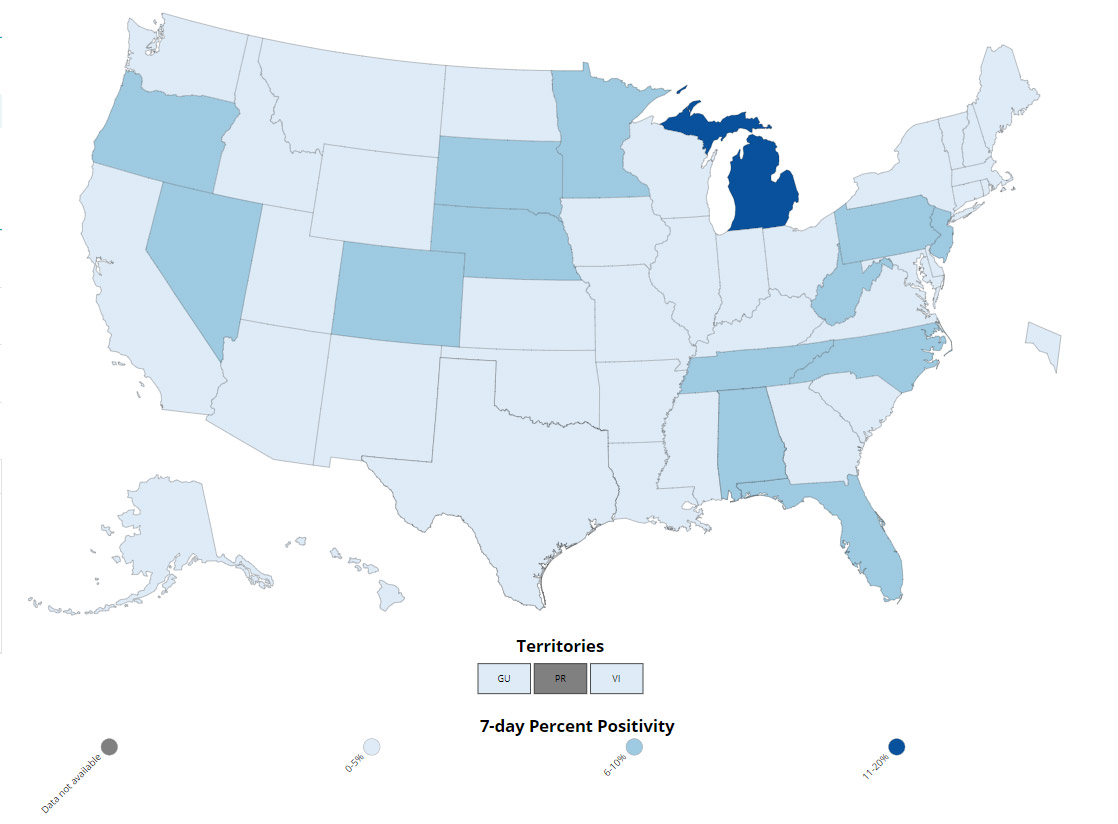
The percentage of COVID-19 RT-PCR tests that are positive (percent positivity) has decreased from the previous week. The 7-day average of percent positivity from tests is now 4.0%. The 7-day average number of tests reported for April 23-April 29 was 1,185,345, down 3.8% from 1,232,468 for the prior 7 days.
421,479,492
Total Tests Reported
421,479,492
Total Tests Reported
1,185,345
7-Day Average Tests Reported
4.0%
7-Day Average % Positivity
421,479,492
Total Tests Reported
4.4 %
Previous 7-Day Average % Positivity
-8.5%
Change in 7-Day Average % Positivity since Prior Week
COVID-19 Viral (RT-PCR) Laboratory Test 7-day Percent Positivity by State/Territory
 Laboratory Test 7-day Percent Positivity by State/Territory")
Vaccinations
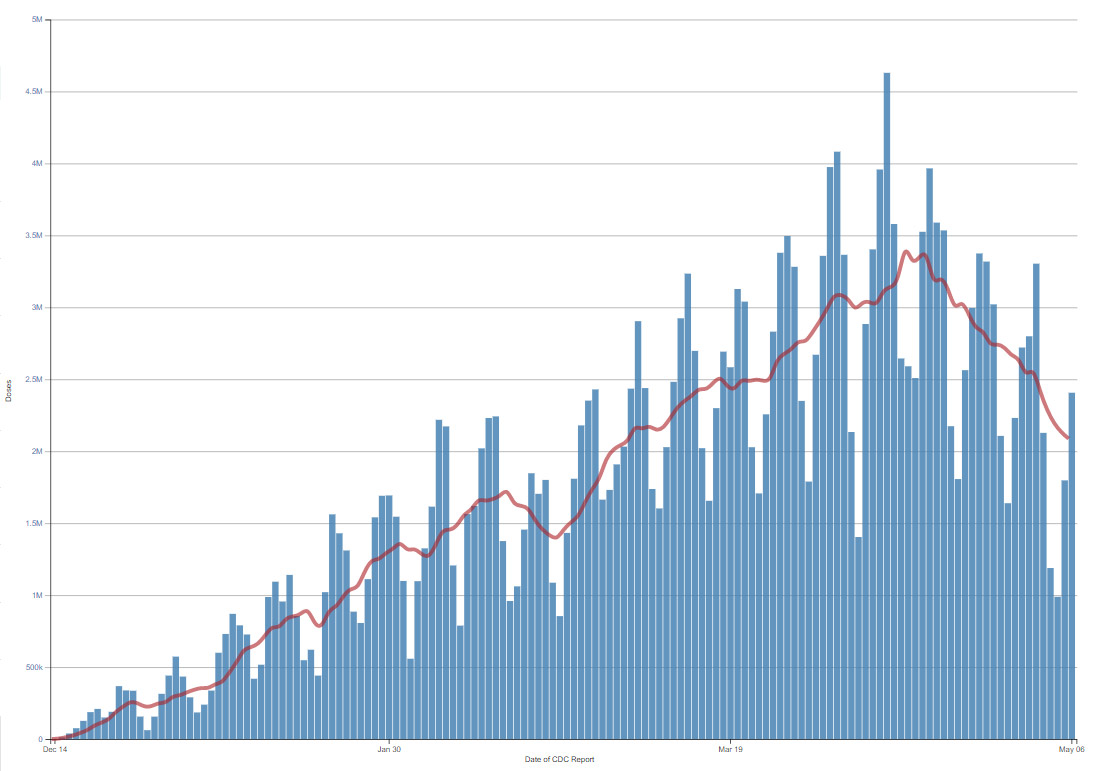
The U.S. COVID-19 Vaccination Program began December 14, 2020. As of May 6, 252 million vaccine doses have been administered. Overall, about 149.5 million people, or 45% of the total U.S. population, have received at least one dose of vaccine. About 108.9 million people, or 32.8% of the total U.S. population, have been fully vaccinated.* As of May 6, the 7-day average number of administered vaccine doses reported to CDC per day was 2.1 million, a 26% decrease from the previous week.
The COVID Data Tracker Vaccination Demographic Trends tab shows vaccination trends by age group. As of May 6, 83.0% of people ages 65 or older have received at least one dose of vaccine and 70.2% are fully vaccinated. Over one-half (57%) of people ages 18 or older have received at least one dose of vaccine and 41.9% are fully vaccinated.
251,973,752
Vaccines Administered
149,462,265
People who received at least one dose
108,926,627
People who are fully vaccinated*
45.0%
Percentage of the US population that has received at least one dose
32.8%
Percentage of the US population that has been fully vaccinated*
+1.7
Percentage point increase from last week
+2.8
Percentage point increase from last week
*People who are fully vaccinated represents the number of people who have received the second dose in a two-dose COVID-19 vaccine series or one dose of the single-shot J&J/Janssen COVID-19 vaccine.
Daily Change in Number of COVID-19 Vaccinations in the United States Reported to CDC
7-Day moving average

Hospitalizations
New Hospital Admissions
The current 7-day average for April 28–May 4 was 4,640. This is an 8.4% decrease from the prior 7-day average (5,066) from April 21–April 27. The 7-day moving average for new admissions has been consistently decreasing since April 19.
2,127,202
Total New Admissions
4,640
Current 7-Day Average
5,066
Prior 7-Day Average
-8.4%
Change in 7-Day Average
Daily Trends in Number of New COVID-19 Hospital Admissions in the United States

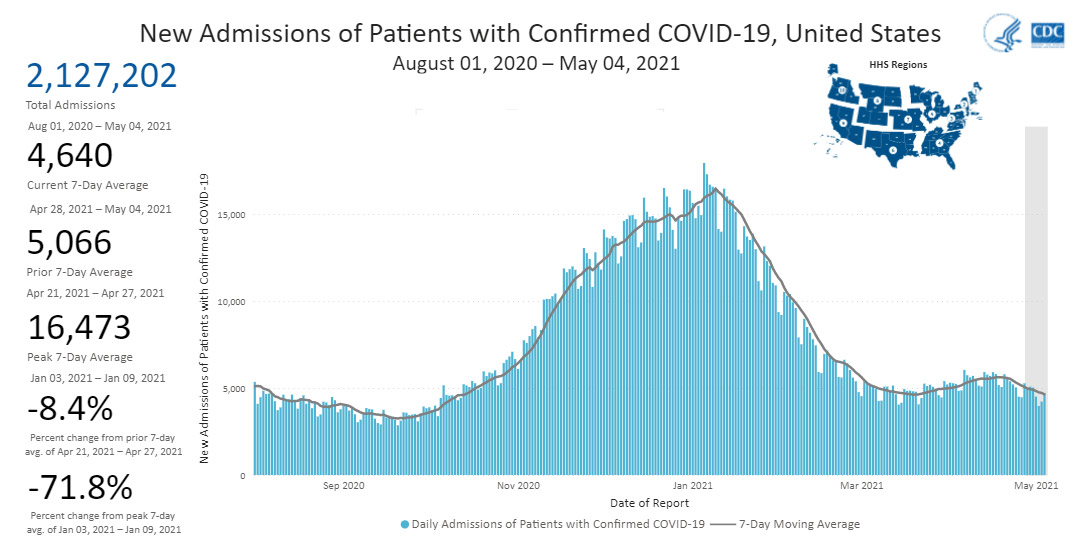
New admissions are pulled from a 10 am EST snapshot of the HHS Unified Hospital Timeseries Dataset. Due to potential reporting delays, data from the most recent 7 days, as noted in the figure above with the grey bar, should be interpreted with caution. Small shifts in historic data may also occur due to changes in the CMS Provider of Services file, which is used to identify the cohort of included hospitals.
COVID-NET: Trends in Hospitalizations in Adults ≥65 Years
Older adults are at increased risk for severe COVID-19 illness, including an increased risk for hospitalization. Since the start of the pandemic, people ages 65 and older were the age group with the largest percentage of COVID-19-associated hospitalizations, sometimes accounting for more than half of hospitalizations. Beginning in January, the proportion of cases in older adults began to decline as overall rates fell. Data from April show that people ages 65 and older now account for fewer than 1 in 3 hospitalizations. Since the beginning of April, people 18–49 years and 50–64 years both account for a larger portion of COVID-19-associated hospitalizations than people 65 years and older. This decline in the proportion of COVID-19-associated hospitalizations in older adults coincides with continued increased vaccination coverage in this age group.
Trends in COVID-19 Associated Hospitalizations in Adults ≥65 Years

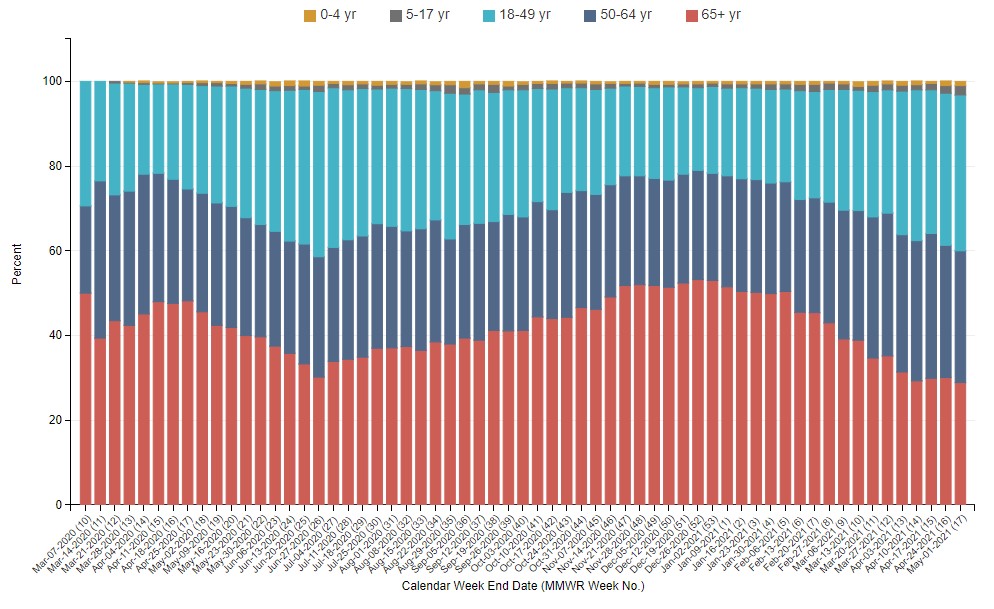
The Coronavirus Disease 2019 (COVID-19)-Associated Hospitalization Surveillance Network (COVID-NET) is an additional source for hospitalization data collected through a network of more than 250 acute-care hospitals in 14 states (representing ~10% of the U.S. population). Detailed data on patient demographics, including race/ethnicity, underlying medical conditions, medical interventions, and clinical outcomes, are collected using a standardized case reporting form.
More COVID-NET DataDeaths
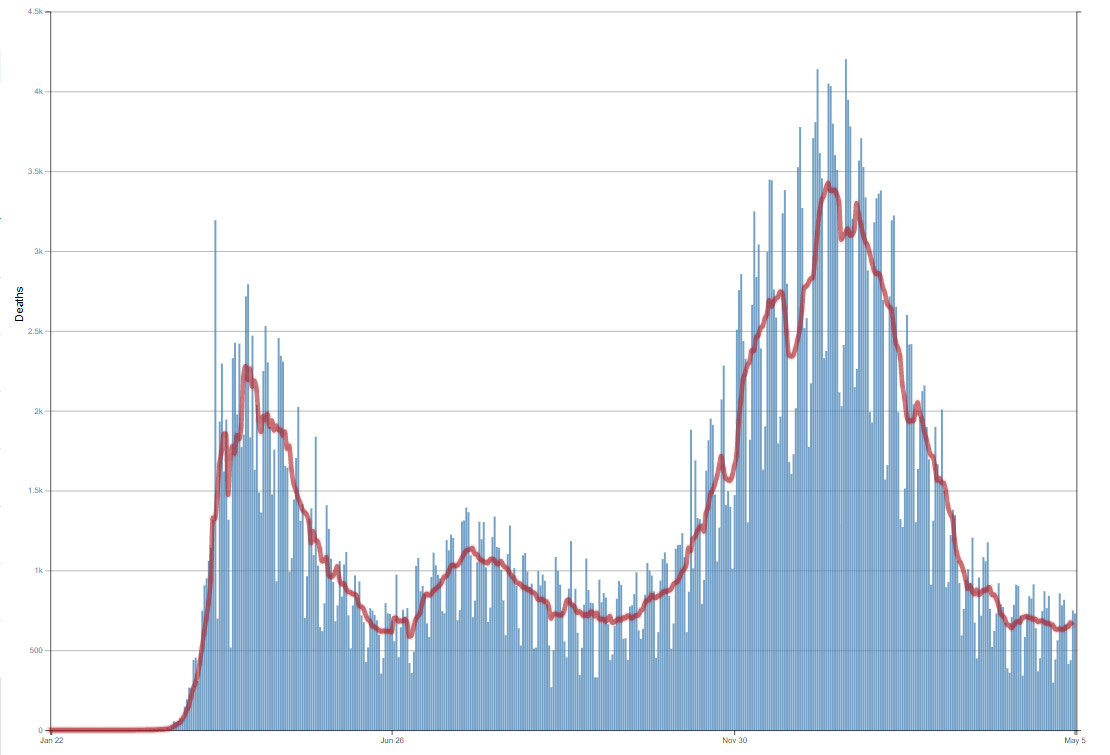
The current 7-day moving average of new deaths (656) increased 3.8% compared with the previous 7-day moving average (632). As of May 5, a total of 576,238 COVID-19 deaths have been reported.
576,238
Total Deaths Reported
656
Current 7-Day Average*
632
Prior 7-Day Average
3.8%
Change in 7-Day Average Since Prior Week
*Historical deaths are excluded from the daily new deaths and 7-day average calculations until they are incorporated into the dataset by their applicable date. Of 14,357 historical deaths reported retroactively, 256 were reported in the current week and 278 were reported in the prior week.
Note: In the above table, historical data with missing report dates are excluded from current and prior 7-day averages, and the percent change in the 7-day average.
Daily Trends in Number of COVID-19 Deaths in the United States Reported to CDC
7-Day moving average
More Death Data
- Rapid Emergence and Epidemiologic Characteristics of the SARS-CoV-2 B.1.526 Variant — New York City, New York, January 1–April 5, 2021
- Identification of and Surveillance for the SARS-CoV-2 Variants B.1.427 and B.1.429 — Colorado, January–March 2021
- Modeling of Future COVID-19 Cases, Hospitalizations, and Deaths, by Vaccination Rates and Nonpharmaceutical Intervention Scenarios — United States, April–September 2021
- Safety Monitoring of the Janssen (Johnson & Johnson) COVID-19 Vaccine — United States, March–April 2021
- Anxiety-Related Adverse Event Clusters After Janssen COVID-19 Vaccination — Five U.S. Mass Vaccination Sites, April 2021
- COVID-19 Outbreak Among Farmworkers — Okanogan County, Washington, May–August 2020
- COVID-19 Among Workers in the Seafood Processing Industry: Implications for Prevention Measures — Alaska, March–October 2020
- Linked Clusters of SARS-CoV-2 Variant B.1.351 — Maryland, January–February 2021
- Postvaccination SARS-CoV-2 Infections Among Skilled Nursing Facility Residents and Staff Members — Chicago, Illinois, December 2020–March 2021
- COVID-19 Outbreak Associated with a SARS-CoV-2 R.1 Lineage Variant in a Skilled Nursing Facility After Vaccination Program — Kentucky, March 2021
Recent COVID Data Tracker Updates
- Updated Vaccination Demographic Trends tab now displays vaccination progress in the United States by sex and racial/ethnic group
- Updated Cases, Deaths, and Testing tab displays case, death, and testing metrics in one location along with the level of community transmission by state, territory, or jurisdiction
- Updated Variant Proportions tab now shows nowcast weighted estimates of variant proportions for the most recent 2-week interval