Aquatics FAQs
Recommendations for Fully Vaccinated People
COVID-19 Homepage
A Needle Today Helps Keep COVID Away
Interpretive Summary for July 9, 2021
A Needle Today Helps Keep COVID Away
The highly transmissible B.1.617.2 (Delta) variant continues to spread across the United States at a rapid pace. Early data suggest that B.1.617.2 now makes up more than 50% of COVID-19 cases. In some parts of the country, this percentage is even higher, especially in areas with low vaccination rates. This rapid rise is concerning and threatens the progress the United States has made toward ending the pandemic.
We have seen the success of the U.S. vaccination program over the last 8 months. As of July 8, 2021, 183.2 million people have received at least one dose of a COVID-19 vaccine, and 158.3 million are fully vaccinated.* However, we are also seeing new and emerging trends that are concerning. Cases and hospitalizations are on the rise in areas with low vaccination coverage. Data from recent weeks show that adults ages 18–49 now account for more than 40% of COVID-19-associated hospitalizations.
Fortunately, we have safe and effective vaccines that prevent severe disease, hospitalization, and death. People who are fully vaccinated are protected from B.1.617.2. If you are not yet vaccinated, you are at risk of infection and should continue to practice prevention strategies and get vaccinated as soon as possible. Turning the corner on the pandemic, getting back to normal, and stopping the spread of B.1.617.2 requires all of us doing our part.
* People are considered fully vaccinated 2 weeks after their second dose in a 2-dose series (such as the Pfizer or Moderna vaccines), or 2 weeks after a single-dose vaccine (such as Johnson & Johnson’s Janssen vaccine). If you don’t meet these requirements, regardless of your age, you are not fully vaccinated. Keep taking all precautions until you are fully vaccinated.
Note to readers: To find a vaccine provider near you, visit Vaccines.gov or your state or local public health department website. You can also text your zip code to 438829 to get 3 locations near you with vaccines in stock. If you prefer your information in Spanish, text your zip code to 822862. You can also call the National COVID-19 Vaccination Assistance Hotline at 1-800-232-0233 to get help in English, Spanish, and more than 150 other languages. It also has a TTY line to support access by hearing impaired callers. If you or someone you know is hesitant about COVID-19 vaccination, CDC has information and answers to frequently asked questions to help inform the decision.
Reported Cases
The current 7-day moving average of daily new cases (14,885) increased 16.0% compared with the previous 7-day moving average (12,832). Compared with the highest peak on January 10, 2021 (251,897), the current 7-day average decreased 94.1%. A total of 33,604,986 COVID-19 cases have been reported as of July 7.
33,604,986
Total Cases Reported
14,885
Current 7-Day Average*
12,832
Prior 7-Day Average
+16.0%
Change in 7-Day Average since Prior Week
*Historical cases are excluded from daily new cases and 7-day average calculations until they are incorporated into the dataset for the applicable date. Of 72,292 historical cases reported retroactively, 697 were reported in the current week and 360 were reported in the prior week.
Daily Trends in COVID-19 Cases in the United States Reported to CDC

7-Day moving average

SARS-CoV-2 Variants
Multiple variants of the virus that causes COVID-19 are circulating globally and within the United States. To date, four variants have been classified as a variant of concern (VOC). Nowcast estimates* of SARS-CoV-2 cases caused by these VOCs for the two weeks ending July 3 are summarized here. Nationally, the proportion of cases attributed to B.1.617.2 (Delta) is predicted to increase to 51.7%, becoming the predominant lineage in the United States; B.1.1.7 (Alpha) proportion is predicted to decrease to 28.7%; P.1 (Gamma) proportion is predicted to decrease to 8.9%; and B.1.351 (Beta) is predicted to decrease slightly to 0.2%. Nowcast estimates predict that B.1.617.2 (Delta) will increase in all HHS regions and be more than 70% in regions 7 and 8. B.1.1.7 (Alpha) is predicted to be less than 50% in all HHS regions. P.1 (Gamma) is predicted to be more than 10% in regions 1, 4, 5, 9, and 10; and B.1.351 (Beta) is predicted to be less than or equal to 0.5% in all HHS regions.
*The median time from specimen collection to sequence data reporting is about 3 weeks. As a result, weighted estimates for the most recent few weeks may be unstable or unavailable. CDC’s Nowcast is a data projection tool that helps fill this gap by generating timely estimates of variant proportions for variants that are circulating in the United States. View Nowcast estimates on CDC’s COVID Data Tracker website on the Variant Proportions page.


Testing
The percentage of COVID-19 NAATs (nucleic acid amplification tests) that are positive (percent positivity) has increased from the previous week. The 7-day average of percent positivity from tests is now 2.7%. The 7-day average number of tests reported for June 25 – July 01 was 558,867, down 7.9% from 606,864 for the prior 7 days.
472,035,159
Total Tests Reported
472,035,159
Total Tests Reported
558,867
7-Day Average Tests Reported
2.7%
7-Day Average % Positivity
472,035,159
Total Tests Reported
2.0%
Previous 7-Day Average % Positivity
+31.9%
Change in 7-Day Average % Positivity since Prior Week
COVID-19 NAAT Laboratory Test 7-day Percent Positivity by State/Territory

Vaccinations
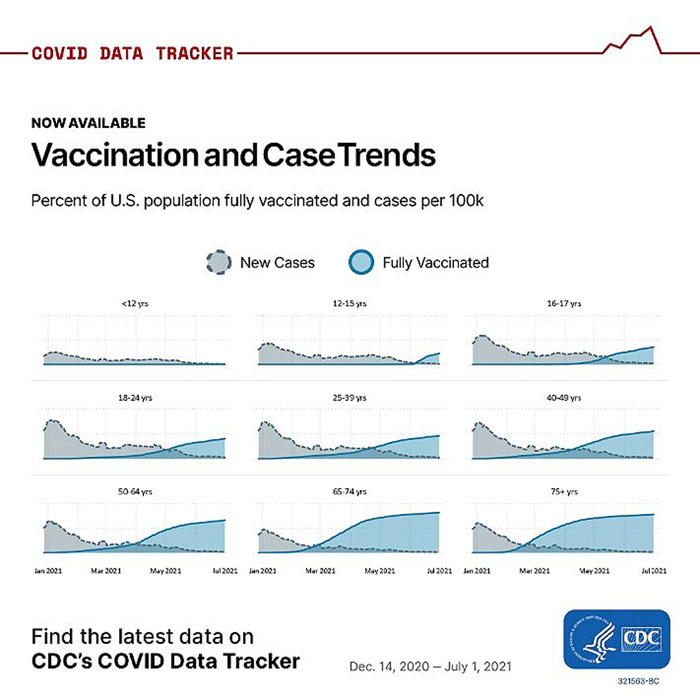
The U.S. COVID-19 Vaccination Program began December 14, 2020. As of July 8, 332.3 million vaccine doses have been administered. Overall, about 183.2 million people, or 55.2% of the total U.S. population, have received at least one dose of vaccine. About 158.3 million people, or 47.7% of the total U.S. population, have been fully vaccinated.* As of July 8, the 7-day average number of administered vaccine doses reported (by date administered) to CDC per day was 239,497, a 54.5% decrease from the previous week.
The COVID Data Tracker Vaccination Demographic Trends tab shows vaccination trends by age group. As of July 8, 88.5% of people ages 65 or older have received at least one dose of vaccine and 78.8% are fully vaccinated. Just over two-thirds (67.3%) of people ages 18 or older have received at least one dose of vaccine and 58.5% are fully vaccinated. For people ages 12 or older, 64.5% have received at least one dose of vaccine and 55.8% are fully vaccinated.
332,345,797
Vaccines Administered
183,237,046
People who received at least one dose
158,287,566
People who are fully vaccinated*
55.2%
Percentage of the US population that has received at least one dose
47.7%
Percentage of the US population that has been fully vaccinated*
+0.6
Percentage point increase from last week
+0.7
Percentage point increase from last week
*People are considered fully vaccinated 2 weeks after their second dose in a 2-dose series (such as the Pfizer or Moderna vaccines), or 2 weeks after a single-dose vaccine (such as Johnson & Johnson’s Janssen vaccine).
Daily Change in Number of COVID-19 Vaccinations in the United States Reported to CDC
7-Day moving average

Hospitalizations
New Hospital Admissions
The current 7-day average for June 29–July 5 was 2,037. This is an 8.6% increase from the prior 7-day average (1,875) from June 23–June 29. The 7-day moving average for new admissions has been consistently increasing since June 28, 2021.
2,297,764
Total New Admissions
2,037
Current 7-Day Average
1,875
Prior 7-Day Average
+8.6%
Change in 7-Day Average
The start of consistent reporting of hospital admissions data was August 1, 2020.
Daily Trends in Number of New COVID-19 Hospital Admissions in the United States

New admissions are pulled from a 10 am EST snapshot of the HHS Unified Hospital Timeseries Dataset. Due to potential reporting delays, data from the most recent 7 days, as noted in the figure above with the grey bar, should be interpreted with caution. Small shifts in historic data may also occur due to changes in the CMS Provider of Services file, which is used to identify the cohort of included hospitals.
COVID-NET: Trends in Hospitalizations in Adults 18–49 Years
CDC’s Coronavirus Disease 2019-Associated Hospitalization Surveillance Network (COVID-NET) shows that since the start of the COVID-19 pandemic, people ages 65 years and older were the age group with the largest percentage of COVID-19-associated hospitalizations, sometimes accounting for more than half of hospitalizations. Data from May and June show that as more adults ages 65 and older became vaccinated, they accounted for fewer than 1 in 3 hospitalizations. However, data from recent weeks show that even though the number of COVID-19-associated hospitalizations continues to decline in all age groups, the proportion of hospitalized adults ages 18–49 years continues to climb and now accounts for more than 40% of COVID-19-associated hospitalizations. Since April, these younger adults now account for more hospitalizations than people 65 years and older, likely reflecting lower vaccination rates in this age group compared with older adults.
Proportion of COVID-19-Associated Hospitalizations by Age Group

The Coronavirus Disease 2019 (COVID-19)-Associated Hospitalization Surveillance Network (COVID-NET) is an additional source for hospitalization data collected through a network of more than 250 acute-care hospitals in 14 states (representing ~10% of the U.S. population). Detailed data on patient demographics, including race/ethnicity, underlying medical conditions, medical interventions, and clinical outcomes, are standardized case reporting form.
More COVID-NET DataDeaths
The current 7-day moving average of new deaths (154) has decreased 25.2% compared with the previous 7-day moving average (205). As of July 7, a total of 603,958 COVID-19 deaths have been reported.
603,958
Total Deaths Reported
154
Current 7-Day Average*
205
Prior 7-Day Average
-25.2%
Change in 7-Day Average Since Prior Week
*Historical deaths are excluded from the daily new deaths and 7-day average calculations until they are incorporated into the dataset by their applicable date. Of 6,134 historical deaths reported retroactively, 30 were reported in the current week and 10 were reported in the prior week.
Daily Trends in Number of COVID-19 Deaths in the United States Reported to CDC
7-Day moving average
More Death Data
- Use of mRNA COVID-19 Vaccine After Reports of Myocarditis Among Vaccine Recipients: Update from the Advisory Committee on Immunization Practices — United States, June 2021
- Efficacy of Portable Air Cleaners and Masking for Reducing Indoor Exposure to Simulated Exhaled SARS-CoV-2 Aerosols — United States, 2021
- Outcomes Among Patients Referred to Outpatient Rehabilitation Clinics after COVID-19 diagnosis — United States, January 2020–March 2021
Recent COVID Data Tracker Updates
- A new Vaccination Equity tab displays a combined county-level view of vaccine coverage and Social Vulnerability Index (SVI) rating to visualize how each county’s vaccine coverage and estimated vulnerability level intersect
- Static bivariate maps that illustrate cases by vaccination coverage were added to the COVID Data Tracker Communications Toolkit