Aquatics FAQs
Recommendations for Fully Vaccinated People
COVID-19 Homepage
Safe and Happy Holidays
Interpretive Summary for December 17, 2021
Safe and Happy Holidays

The United States recently surpassed 50 million COVID-19 cases and 800,000 deaths since the start of the pandemic. This week also marks the first anniversary of the first COVID-19 vaccination in the United States. In recent weeks, COVID-19 cases and hospitalizations have increased, with many parts of the country experiencing substantial or high levels of community transmission. These increases and the recent emergence of the Omicron variant highlight the importance of prevention strategies to help people stay safe and reduce the spread of the virus that causes COVID-19.
Although we are still learning about Omicron, we’ve been fighting COVID-19 since last year and have the tools to end the pandemic. The United States saw the highest peak in COVID-19 cases in January 2021, following the 2020 holiday season. But this year, we have the most important protection of all: vaccination. As people start to travel and gather this year, COVID-19 vaccination, along with other important prevention strategies, continues to be our best defense against severe disease.
- Get a COVID-19 vaccine as soon as you can. If you’re eligible for a booster shot, get one now. Find a vaccine.
- Wear a mask that covers your nose and mouth when in indoor public places.
- Whenever possible, stay 6 feet apart from people who don’t live with you.
- Avoid crowds and poorly ventilated indoor spaces.
- Consider self-testing before indoor gatherings. If you are sick or have symptoms, don’t go.
- Wash your hands often with soap and water. Use hand sanitizer if soap and water aren’t available.
Holiday traditions are important for many people. Using proven prevention strategies, we can enjoy safer holidays, travel, and protect our own health as well as the health of our family and friends.
Note to readers: CDC will not publish the COVID Data Tracker Weekly Review on Friday, December 24, 2021, and Friday, December 31, 2021. The Weekly Review will resume publication on Friday, January 7, 2022.
- COVID Data Tracker’s Vaccine Effectiveness tab now allows users to filter graphs by age group and vaccine product.
- COVID Data Tracker’s Nursing Homes COVID-19 Data Dashboard now includes a graph that shows COVID-19 cases by vaccination status among nursing home residents.
- SARS-CoV-2 B.1.1.529 (Omicron) Variant — United States, December 1–8, 2021
- Booster and Additional Primary Dose COVID-19 Vaccinations Among Adults Aged ≥65 Years — United States, August 13, 2021–November 19, 2021
- Report of Health Care Provider Recommendation for COVID-19 Vaccination Among Adults, by Recipient COVID-19 Vaccination Status and Attitudes — United States, April–September 2021
Reported Cases
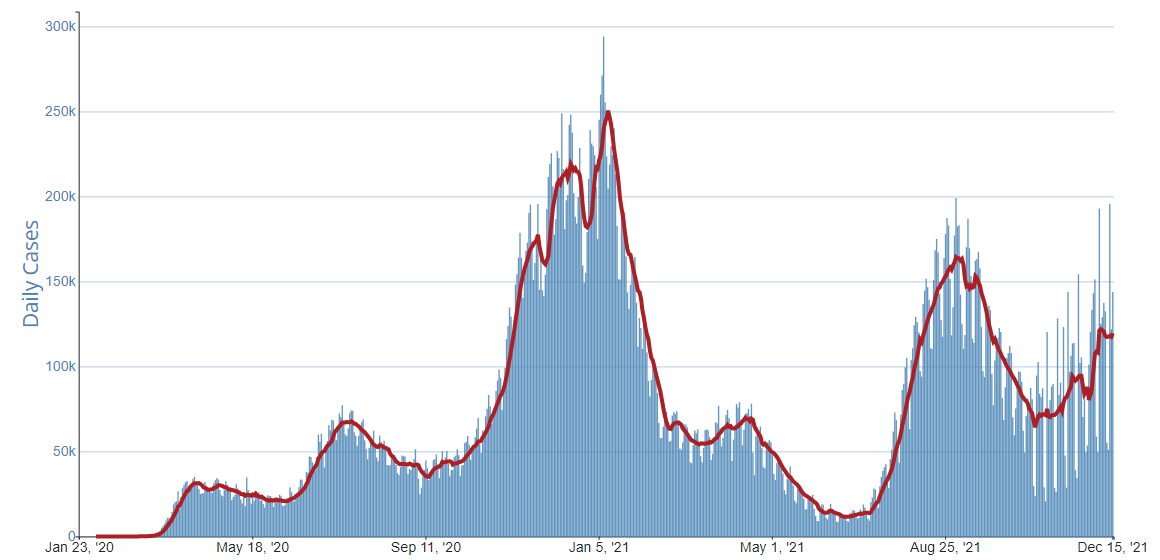
The current 7-day moving average of daily new cases (122,297) increased 1.5% compared with the previous 7-day moving average (120,445). A total of 50,479,372 COVID-19 cases have been reported in the United States as of December 15, 2021.
Currently two variants, Omicron and Delta, are classified as Variants of Concern (VOC) in the United States. CDC’s COVID Data Tracker shows that the proportion of the Omicron variant circulating in the United States is predicted to increase from last week. Delta remains the predominant variant in the United States. Nowcast projections* for the week ending December 11, 2021, predict the national proportion of Omicron to be 2.9% and Delta to be 96.7%. The proportion of Omicron is predicted to be higher than the national proportion in HHS regions 2 and 7. The proportions of Delta are predicted to be greater than 86% in all HHS regions.
CDC has been actively monitoring and preparing for the Omicron variant and will continue to work with other U.S. and global public health and industry partners to learn more. For more information on variant proportions, visit COVID Data Tracker.
50,479,372
Total Cases Reported
122,297
Current 7-Day Average**
120,445
Prior 7-Day Average
+1.5%
Change in 7-Day Average since Prior Week
*The median time from specimen collection to sequence data reporting is about 3 weeks. As a result, weighted estimates for the most recent few weeks may be unstable or unavailable. CDC’s Nowcast is a data projection tool that helps fill this gap by generating timely estimates of variant proportions for variants that are circulating in the United States. View Nowcast estimates on CDC’s COVID Data Tracker website on the Variant Proportions page.
**Historical cases are excluded from daily new cases and 7-day average calculations until they are incorporated into the dataset for the applicable date. Of 353,023 historical cases reported retroactively, 4,753 were reported in the current week and 126 were reported in the prior week.
Daily Trends in COVID-19 Cases in the United States Reported to CDC

7-Day moving average

Vaccinations
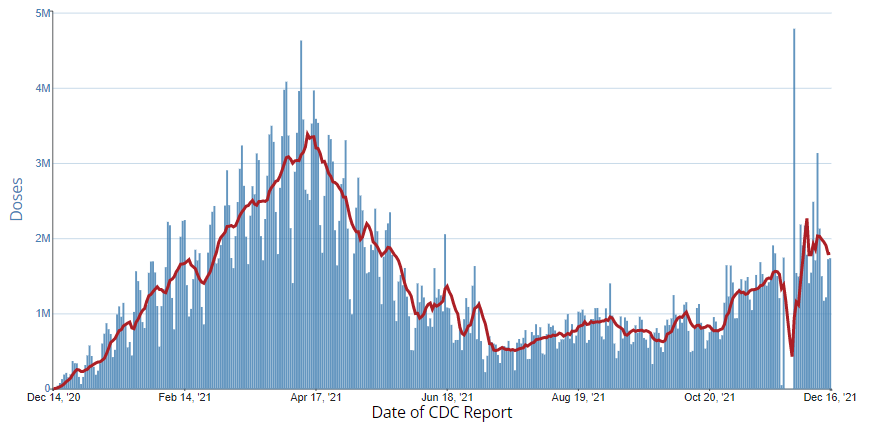
The U.S. COVID-19 Vaccination Program began December 14, 2020. As of December 16, 2021, 490.0 million vaccine doses have been administered. Overall, about 240.3 million people, or 72.4% of the total U.S. population, have received at least one dose of vaccine. About 203.2 million people, or 61.2% of the total U.S. population, have been fully vaccinated.* About 57.1 million additional/booster doses in fully vaccinated people have been reported. As of December 16, 2021, the 7-day average number of administered vaccine doses reported (by date of CDC report) to CDC per day was 1,799,583, a 3.0% decrease from the previous week.
CDC’s COVID Data Tracker Vaccination Demographic Trends tab shows vaccination trends by age group. As of December 16, 2021, 95.0% of people ages 65 years or older have received at least one dose of vaccine and 87.3% are fully vaccinated. More than three-quarters (84.7%) of people ages 18 years or older have received at least one dose of vaccine and 72.3% are fully vaccinated. For people ages 12 years or older, 82.7% have received at least one dose of vaccine and 70.5% are fully vaccinated. For people ages 5 years or older, 76.9% have received at least one dose of vaccine and 65.1% are fully vaccinated.
490,030,849
Vaccines Administered
240,321,022
People who received at least one dose
203,159,327
People who are fully vaccinated*
72.4%
Percentage of the U.S. population that has received at least one dose
61.2%
Percentage of the U.S. population that has been fully vaccinated*
+0.9
Percentage point increase from last week
+0.7
Percentage point increase from last week
*Represents the number of people who have received the second dose in a two-dose COVID-19 vaccine series (such as the Pfizer or Moderna vaccines) or one dose of the single-shot Johnson & Johnson’s Janssen vaccine.
Daily Change in the Total Number of Administered COVID-19 Vaccine Doses Reported to CDC by the Date of CDC Report, United States
7-Day moving average

Hospitalizations
New Hospital Admissions
The current 7-day daily average for December 8–December 14, 2021, was 7,814. This is a 4.4% increase from the prior 7-day average (7,482) from December 1 –December 7, 2021.
3,529,651
Total New Admissions
7,814
Current 7-Day Average
7,482
Prior 7-Day Average
+4.4%
Change in 7-Day Average
The start of consistent reporting of hospital admissions data was August 1, 2020.
Daily Trends in Number of New COVID-19 Hospital Admissions in the United States

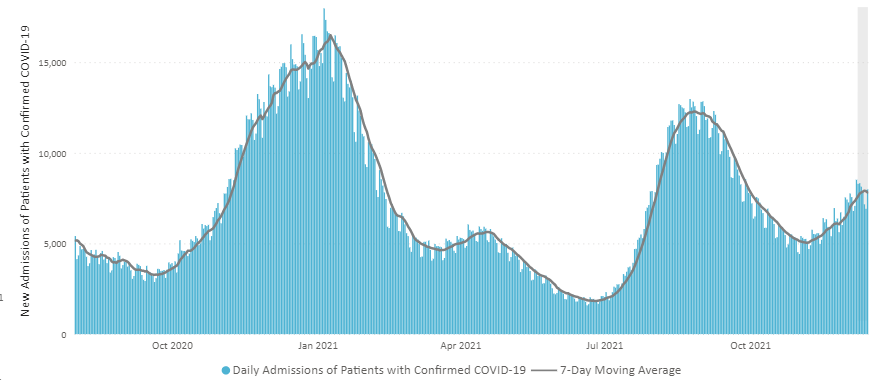
New admissions are pulled from a 10 am EST snapshot of the HHS Unified Hospital Timeseries Dataset. Due to potential reporting delays, data from the most recent 7 days, as noted in the figure above with the grey bar, should be interpreted with caution. Small shifts in historic data may also occur due to changes in the Centers for Medicare and Medicaid Services (CMS) Provider of Services file, which is used to identify the cohort of included hospitals.
COVID-NET: Hospitalization Rates in Children Ages 4 Years and Younger
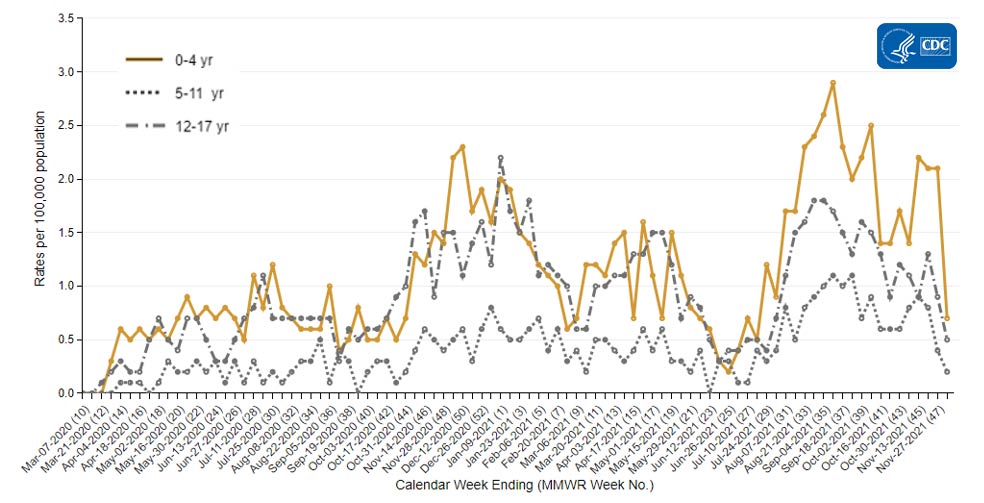
CDC’s Coronavirus Disease 2019-Associated Hospitalization Surveillance Network (COVID-NET) shows that hospitalization rates remain elevated in young children. For the week ending November 27, the weekly rate of COVID-19-associated hospitalizations for children ages 4 years and younger is 1.9 per 100,000. The rate of hospitalization in this age group is higher than rates seen for both older children ages 5–11 years (0.4 per 100,000) and adolescents ages 12–17 years (0.9 per 100,000). Unlike older children and adolescents, children ages 4 years and younger are not yet eligible for any of the available COVID-19 vaccines.
Hospitalization Rates in Children Ages 4 Years and Younger

The Coronavirus Disease 2019 (COVID-19)-Associated Hospitalization Surveillance Network (COVID-NET) is an additional source for hospitalization data collected through a network of more than 250 acute-care hospitals in 14 states (representing ~10% of the U.S. population). Detailed data on patient demographics, including race/ethnicity, underlying medical conditions, medical interventions, and clinical outcomes, are standardized case reporting form.
More COVID-NET DataDeaths
The current 7-day moving average of new deaths (1,180) has increased 8.2% compared with the previous 7-day moving average (1,090). As of December 15, 2021, a total of 800,939 COVID-19 deaths have been reported in the United States.
800,939
Total Deaths Reported
1,180
Current 7-Day Average*
1,090
Prior 7-Day Average
+8.2%
Change in 7-Day Average Since Prior Week
*Historical deaths are excluded from the daily new deaths and 7-day average calculations until they are incorporated into the dataset by their applicable date. Of 15,386 historical deaths reported retroactively, 418 were reported in the current week; and 407 were reported in the prior week.
Daily Trends in Number of COVID-19 Deaths in the United States Reported to CDC
7-Day moving average
 More Death Data
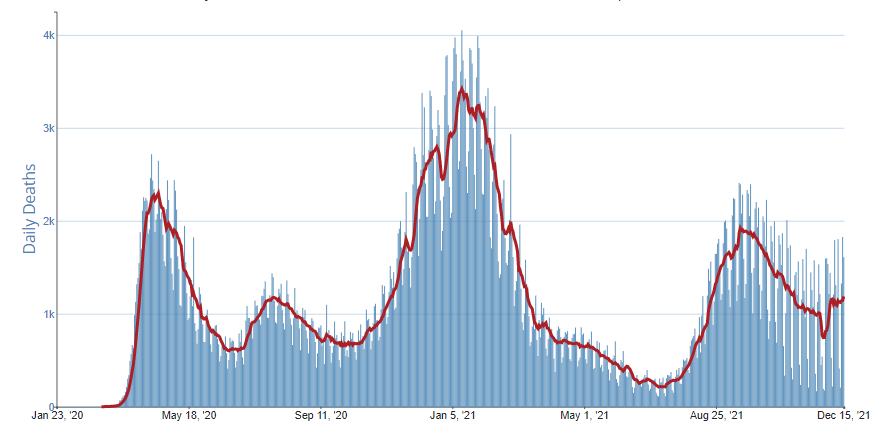
Testing
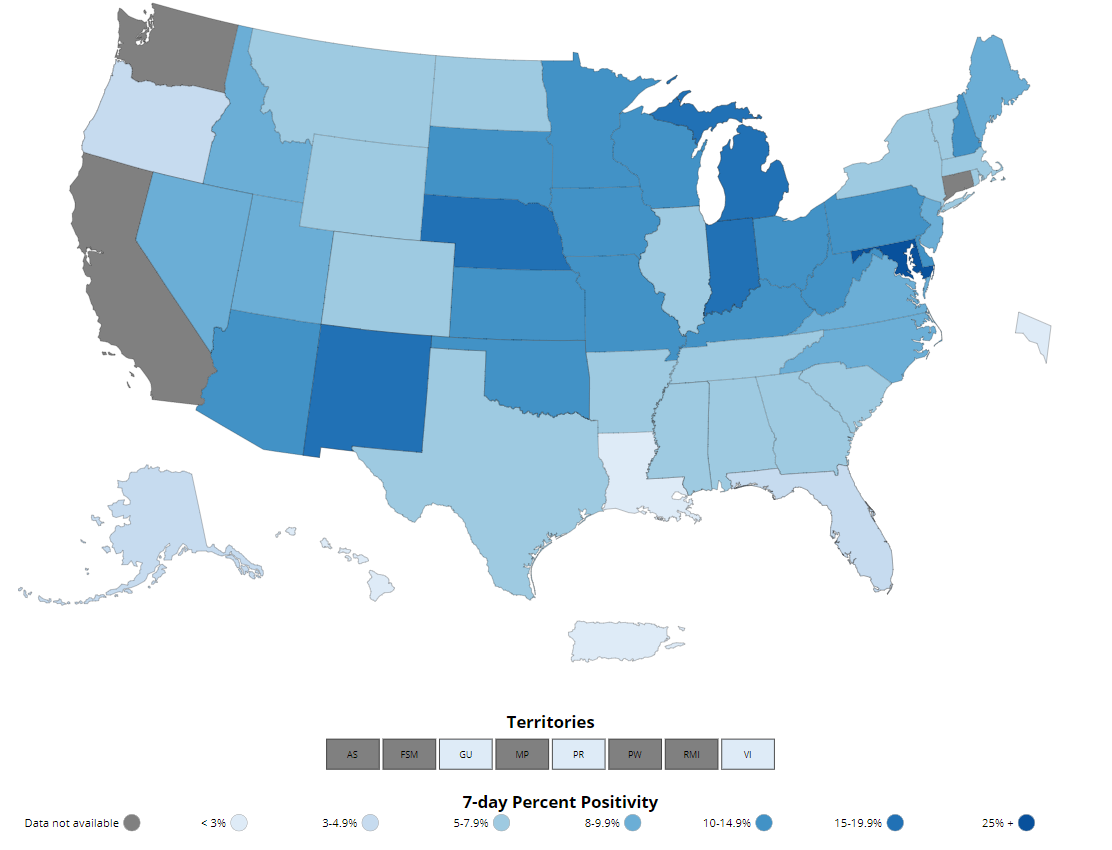
The percentage of COVID-19 NAATs (nucleic acid amplification tests)* that are positive (percent positivity) is decreasing in comparison to the previous week. The 7-day average of percent positivity from NAATs is now 7.2%. The 7-day average number of tests reported for December 3–December 9, 2021, was 1,526,543 up 12.6% from 1,355,909 for the prior 7 days.
687,953,775
Total Tests Reported
687,953,775
Total Tests Reported
1,526,543
7-Day Average Tests Reported
7.2%
7-Day Average % Positivity
687,953,775
Total Tests Reported
7.4%
Previous 7-Day Average % Positivity
-0.13
Percentage point change in 7-Day Average % Positivity since Prior Week
*Test for SARS-CoV-2, the virus that causes COVID-19
COVID-19 NAAT Laboratory Test 7-day Percent Positivity by State/Territory

A Closer Look
A Closer Look Section presents more detailed information for readers who want to learn more about current issues of interest.

Know More about the Omicron Variant
On November 24, 2021, a new variant of SARS-CoV-2, B.1.1.529, was reported to the World Health Organizationexternal icon (WHO). This new variant was first detected in specimens collected on November 11, 2021, in Botswana and on November 14, 2021, in South Africa. On November 26, 2021, WHO named the variant Omicron and classified it as a Variant of Concern (VOC). Four days later, on November 30, the U.S. government SARS-CoV-2 Interagency Group also designated Omicron as a VOC. On December 1, 2021, the first confirmed U.S. case of Omicron was identified in California. As of December 15, 2021, 70 countries have verified SARS-CoV-2 infections caused by the Omicron variant.
CDC has been working with state and local public health officials to monitor the spread of Omicron in the United States. Multiple states have now detected Omicron cases. On December 10, 2021, CDC released an MMWR article summarizing characteristics of the first infections in the United States with the Omicron variant, along with prevention strategies to slow the spread.
In the United States, CDC uses genomic surveillance to track variants of SARS-CoV-2. CDC’s national genomic surveillance can detect a variant that is circulating at 0.1% frequency with 99% statistical confidence. There is a two- to three-week lag between sample collection for SARS-CoV-2 testing to producing and analyzing sequence data, so it is likely that more U.S. infections with Omicron from late November will be detected over the coming days. To provide more timely estimates of variant proportions while more recent specimens are being processed, CDC also provides “Nowcast” data. Nowcast is a model that estimates more recent proportions of circulating variants and enables timely public health action. CDC’s genomic surveillance system will continuously monitor the proportion of infections from Omicron and other variants.
The Omicron variant contains more changes in the spike protein than have been observed in other variants, including 15 in the receptor binding domain (RBD). (The spike protein is the primary target of vaccine-induced immunity.) There are also changes and deletions in other regions of the genome. Based on preliminary laboratory data, significant reductions in neutralizing activity of sera from vaccinated or previously infected individuals against Omicron have been reported. Based on data from other variants with significantly fewer changes in the RBD, the expectation is that the Omicron variant will remain susceptible to some monoclonal antibody treatments, while others may have less potency.
Scientists around the world are working quickly to learn more about the Omicron variant and better understand how easily it might be spread, how severe illness is with this variant, and how effective diagnostic tests, vaccines, and therapeutics are for this variant. Preliminary information from South Africaexternal icon indicates that there are no unusual symptoms associated with Omicron variant infection, and as with other variants, some patients are asymptomatic. CDC will be prioritizing multiple studies to better understand the Omicron variant.
We expect current vaccines to protect against severe illness, hospitalizations, and deaths from infection with the Omicron variant. However, Omicron might cause more breakthrough infections than prior variants, though information on the extent of vaccine protection against infection is not yet available.
It is important to remember that despite the increased attention of Omicron, Delta continues to be the main variant circulating in the United States. For the week ending December 11, 2021, the Delta variant accounted for 96.7% of circulating SARS-CoV-2 variants and Omicron accounted for 2.9% of circulating SARS-CoV-2 variants. The recent emergence of Omicron and the fact that Delta is still the dominant strain further emphasize the importance of getting a primary vaccination series and, if eligible, a booster.