Expanded Access (compassionate use) submission data
CDER, CBER and CDRH Expanded Access INDs and Protocols (2015-2019)
On this page you will find:
- The Center for Drug Evaluation and Research (CDER) and the Center for Biologics Evaluation and Research (CBER) expanded access submission receipt reports for INDs and Protocols from 2015-2019
- The Center for Devices and Radiological Health (CDRH) expanded access requests from 2015-2019
The reports are broken down to the following:
FY 2015 – 2019 (most recent 5 years) Graphs of Expanded Access Submissions
To view the graph select the appropriate link below.
For older graphs, see archive page.
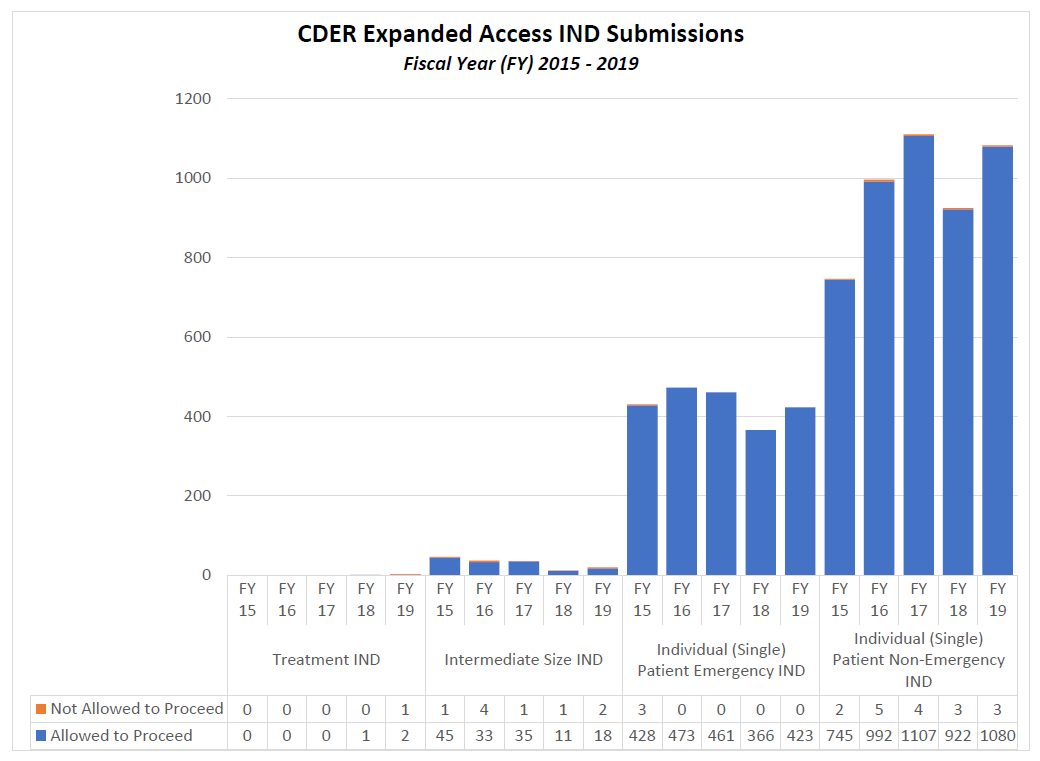
Expanded Access INDs for CDER and CBER (2015-2019)
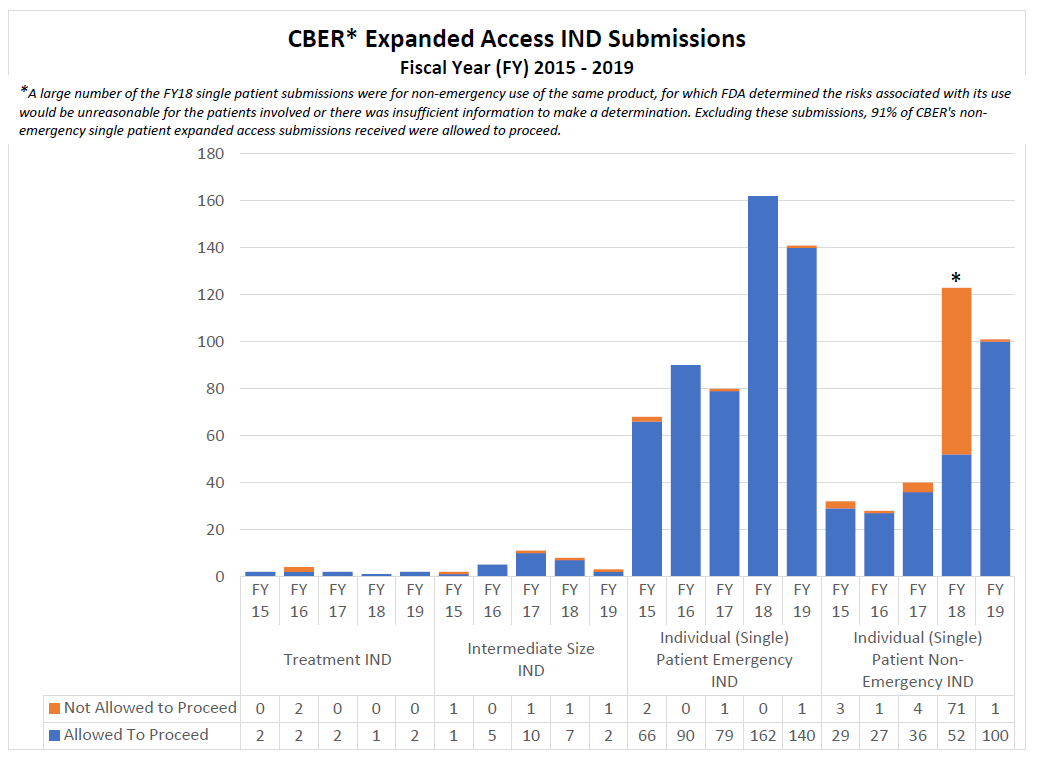
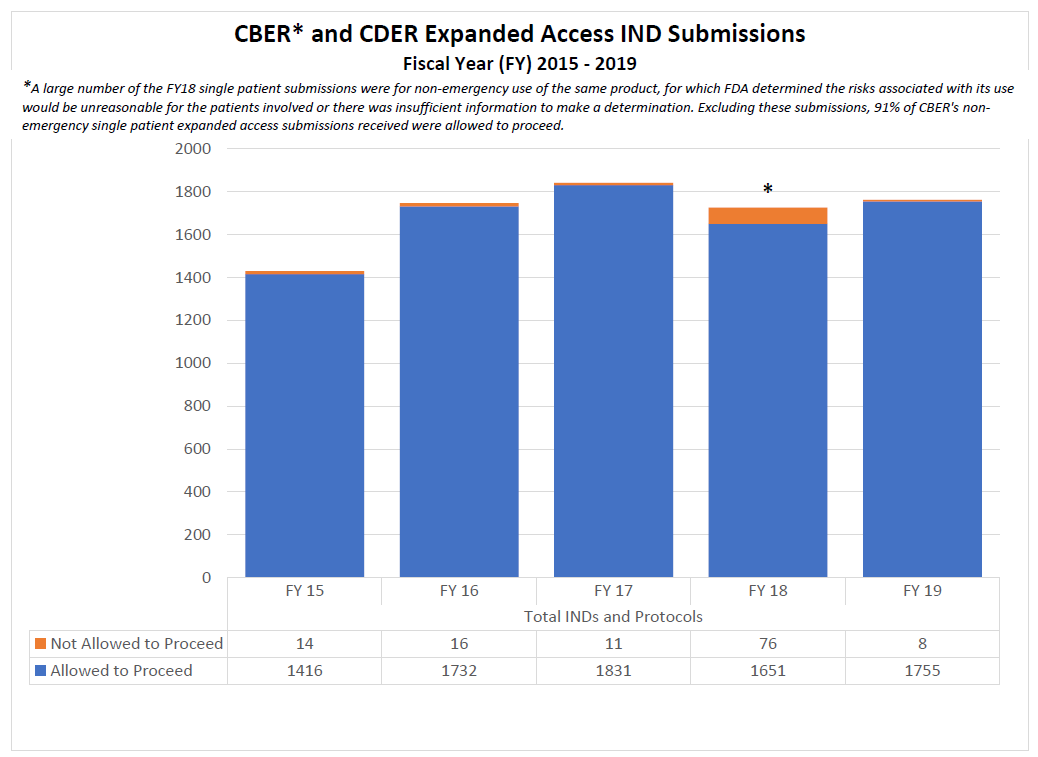
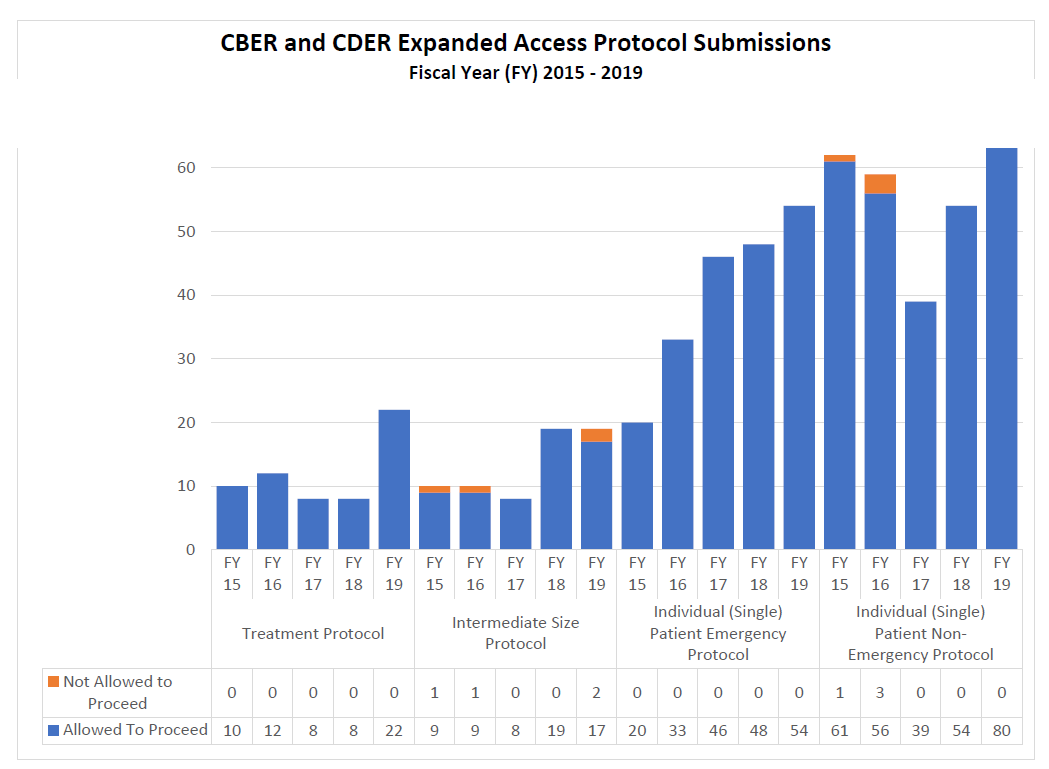
* A large number of the single patient expanded access submissions were for non-emergency use of the same product, for which FDA determined the risks associated with its use would be unreasonable for the patients involved or there was insufficient information to make a determination. Excluding these submissions, 91% of CBER’s non-emergency single patient expanded access submissions received were allowed to proceed.
For tables with older data, see archive page.
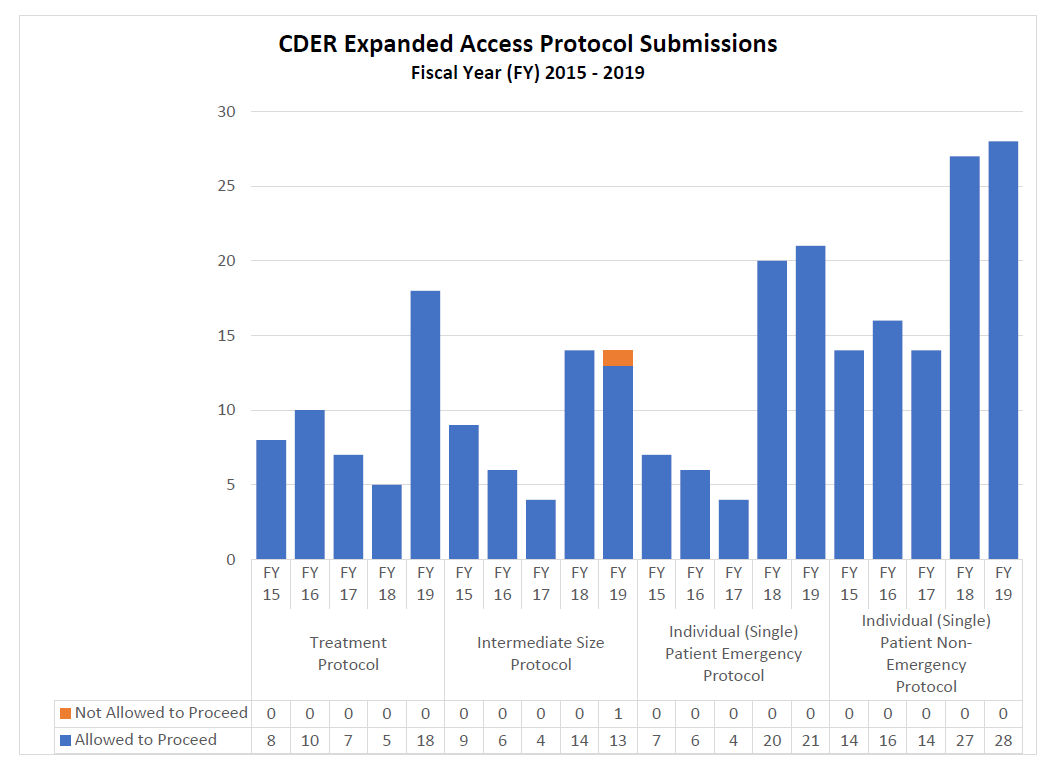
Expanded Access Protocols for CDER and CBER (2015-2019)
FY 2015 – 2019 Graphs of Expanded Access Submissions
CDER Expanded Access INDs and Protocol (2015-2019)
CBER Expanded Access INDs and Protocols (2015-2019)
Combined CDER and CBER Expanded Access Submissions and Protocols (2015-2019)
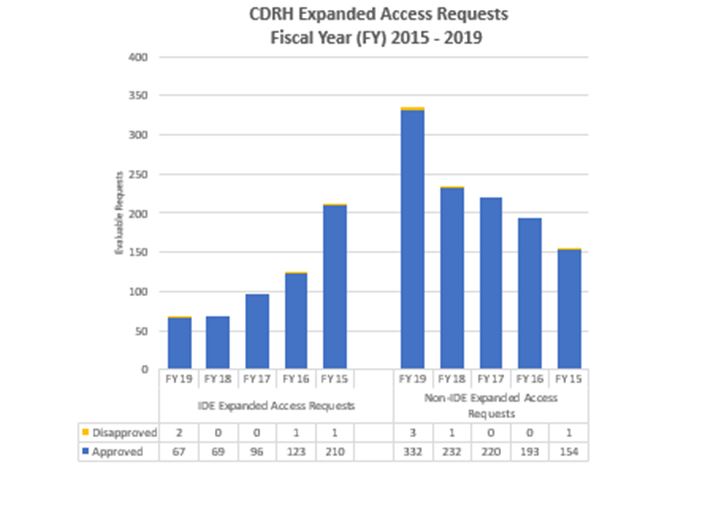
CDRH Expanded Access Requests (2015-2019)
FY 2014-2018 Graph of CDRH Expanded Access Requests
CDRH IDE Expanded Access Requests (2015-2019)1
| Expanded Access Totals | |||||
|---|---|---|---|---|---|
| FY 2015 | FY 2016 | FY 2017 | FY 2018 | FY 2019 | |
| Requested Received | 222 | 136 | 100 | 79 | 76 |
| Evaluable Requests2 | 211 | 124 | 96 | 69 | 69 |
| Approved | 210 | 123 | 96 | 69 | 67 |
| Percentage Approved3 | 99.5% | 99.2% | 100.0% | 100.0% | 97.1% |
1 1Expanded Access IDE requests in CDRH reflect compassionate use (single patient or small population) requests.
2 2Evaluable requests are decisions in which a substantive review was performed on an expanded access request (individual patient or small group access) resulting in an approval, approval with conditions, or disapproval decision.
3 Based on approved requests to total number of evaluable requests.
CDRH Non-IDE Expanded Access Requests(2014-2018)1
| Expanded Access Totals | |||||
|---|---|---|---|---|---|
| FY 2015 | FY 2016 | FY 2017 | FY 2018 | FY 2019 | |
| Requested Received | 167 | 198 | 230 | 257 | 352 |
| Evaluable Requests2 | 155 | 196 | 220 | 233 | 335 |
| Approved | 154 | 196 | 220 | 232 | 332 |
| Percentage Approved3 | 99.4% | 100.0% | 100.0% | 99.6% | 99.1% |
1 Expanded Access requests outside of an IDE are limited to single patient compassionate use requests.
2 Evaluable requests are requests in which a substantive review was performed on an original, non-IDE compassionate use request resulting in an approval or disapproval decision.
3 Based on approved requests to total number of evaluable requests.

